Highlights on Return on Fundraising Analysis
Key Findings Outlined by Sector, Size, and Market
Based on 2017 reported financials
How Do Fundraising Returns Compare Across Arts Sectors?
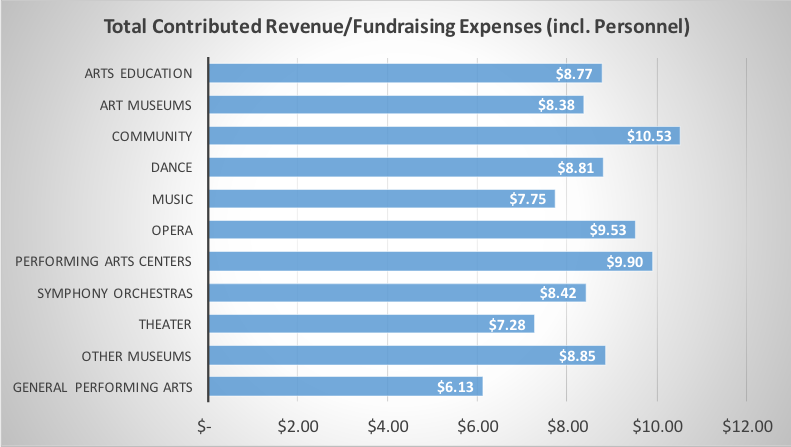
Taken together, we see how similar the sectors can be on some measures. The difference in Return on Fundraising is within $1 for the Art Museum, Orchestra, Arts Education, Dance, and Other Museums sectors despite varying levels of magnitude across these sectors in terms of fundraising expense and total contributions.
- The Community-based sector had the highest Return on Fundraising at $10.53, followed by Performing Arts Centers. General performing arts was the lowest, bringing in $6.13 return for each fundraising dollar spent, followed by the Theatre sector.
- The Symphony Orchestra and Art Museum sectors had similar Return on Fundraising even though fundraising expense and contributed revenue were roughly 5 times higher for the average Art Museum than for the average Symphony Orchestra.
Comparing the Averages of Small, Medium, and Large Organizations
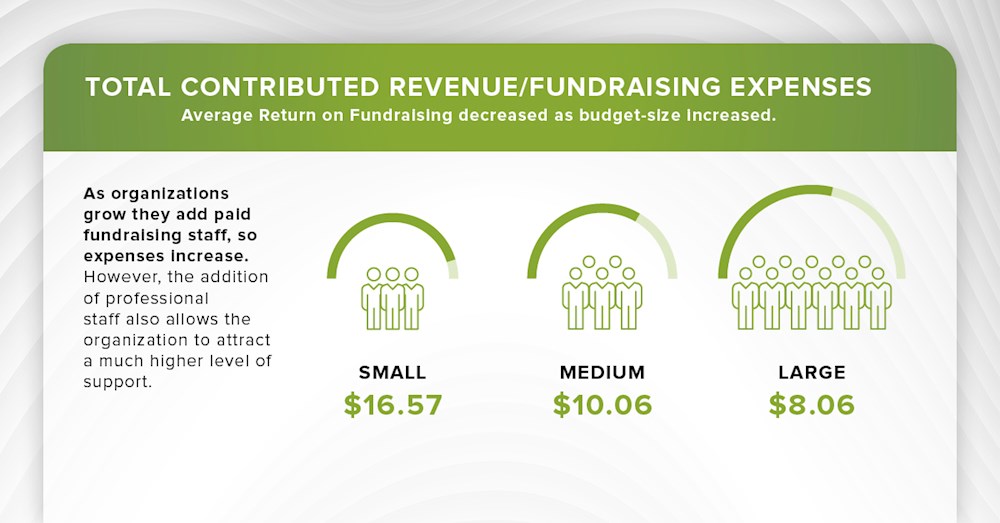
A key finding in comparing organization size, is that the average Return on Fundraising decreased as budget-size increased.
We found that small organizations tend to be more reliant on volunteer labor to help them raise funding than their larger counterparts. As organizations grow they add more paid fundraising staff, so expenses naturally increase as well.
An upside to the addition of professional staff, is that it allows the organization to attract a much higher level of support from sources including individuals, government, and foundations.
Which Markets Saw the Highest Returns?
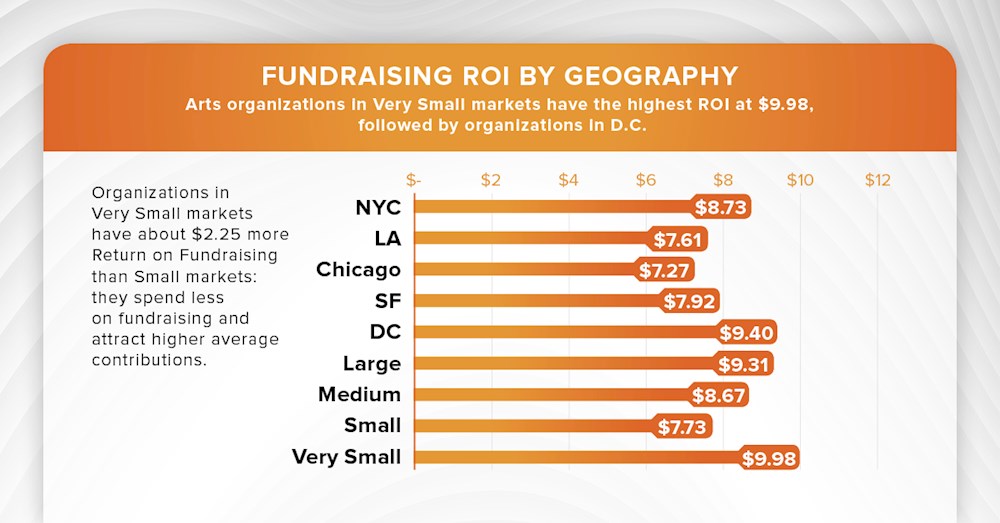
These findings reflect the average Return on Fundraising for each of these markets across the country in 2017.
- Arts organizations in Chicago have the lowest return on fundraising at $7.27 followed by Los Angeles organizations. Arts organizations in Very Small Markets have the highest Return on Fundraising at $9.98, followed by organizations in D.C.
- Organizations in Very Small markets have about $2.25 more Return on Fundraising than Small markets: they spend less on fundraising and attract higher average contributions.
- Next to Small and Very Small Markets, Los Angeles organizations have the lowest fundraising expenses and contributed revenue while New York organizations have the highest.
- Chicago organizations tend to spend 56% more in fundraising expenses and bring in about 49% more in contributed revenue than Los Angeles organizations, but Chicago has the lowest Return on Fundraising, attesting to the varied nature of the arts and culture ecology in different markets.
- San Francisco organizations have almost two and a half times more fundraising expense and contributed income than Los Angeles organizations but the Return on fundraising is just 31 cents higher for San Francisco organizations.
 To raise money, you have to spend money wisely. Cultural leaders can use these findings from 2017 as a benchmark for determining whether the funds they generate per dollar spent on fundraising are in line with organizations like theirs.