What Drives Positive Returns on Fundraising?
Identifying Performance Indicators
What Drives Total Contributed Revenue
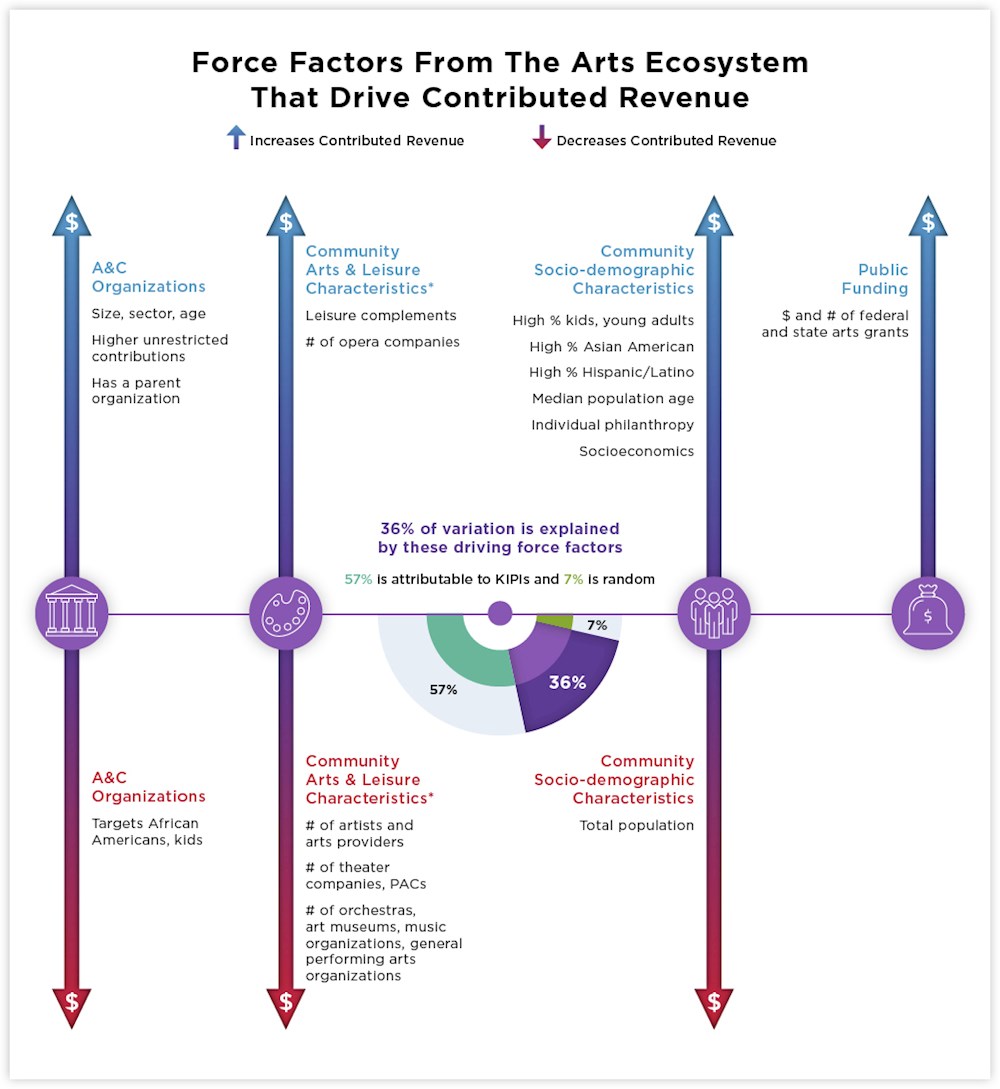
What organizational characteristics affect this performance?
We take into account each organization’s level of unrestricted contributed revenue as a starting place for examining the effects of various factors on total contributed revenue. Doing so focuses the effects of driving forces on elements that drive a difference between unrestricted versus total contributed revenue – i.e., temporarily and permanently restricted revenue.
- Total contributions tend to increase with budget size, sector and age of the organization. Having a parent organization has a positive influence on total contributions.
- When organizations target kids and African Americans, the total contributed revenue tends to be lower.
How do community arts and leisure characteristics affect performance?
- Total contributed revenue tends to be higher for organizations in communities with more leisure activities, which can act as complements.
- Having more opera companies in a community tends to raise the total contributed revenue tide for all organizations in this sector, while having more artists and art providers, theater companies, PACs, orchestras, art museums, music organizations and general performing arts organizations tend to lower the total contributed revenue for all organizations in these sectors.
How do socio-demographic characteristics of the community affect performance?
- Total contributed revenue is higher for organizations in communities where the population has a higher percentage of kids and young adults. The higher percentage of Asian American and Hispanic/Latino populations has a positive influence on total contributed revenue. This is also the case where the population’s median age is higher.
- As the level of individual philanthropy and socio-economics in the market increases, total contributed revenue goes up.
- The total contributed revenue tends to be lower as the total population increases.
What impact does public funding have on performance?
- Overall state and federal grant activity in the larger local marketplace has a positive effect on an individual organization’s total contributed revenue.
57% of what drives total contributed revenue is attributable to expertise.
 Intangibles such as fundraising expertise, strong relationship building, quality of the work, and reputation affect an organization’s performance ability to attract contributed revenue. High percentages imply that there exists a significant store of intellectual capital that is driving the difference between low-performing and high-performing arts and cultural organizations with respect to this revenue measure. 36% of the factors that drive total contributed revenue are explained by elements of the arts and cultural ecosystem. 7% of the variation in the amount of total contributions is random.
What Drives Total Fundraising Expenses
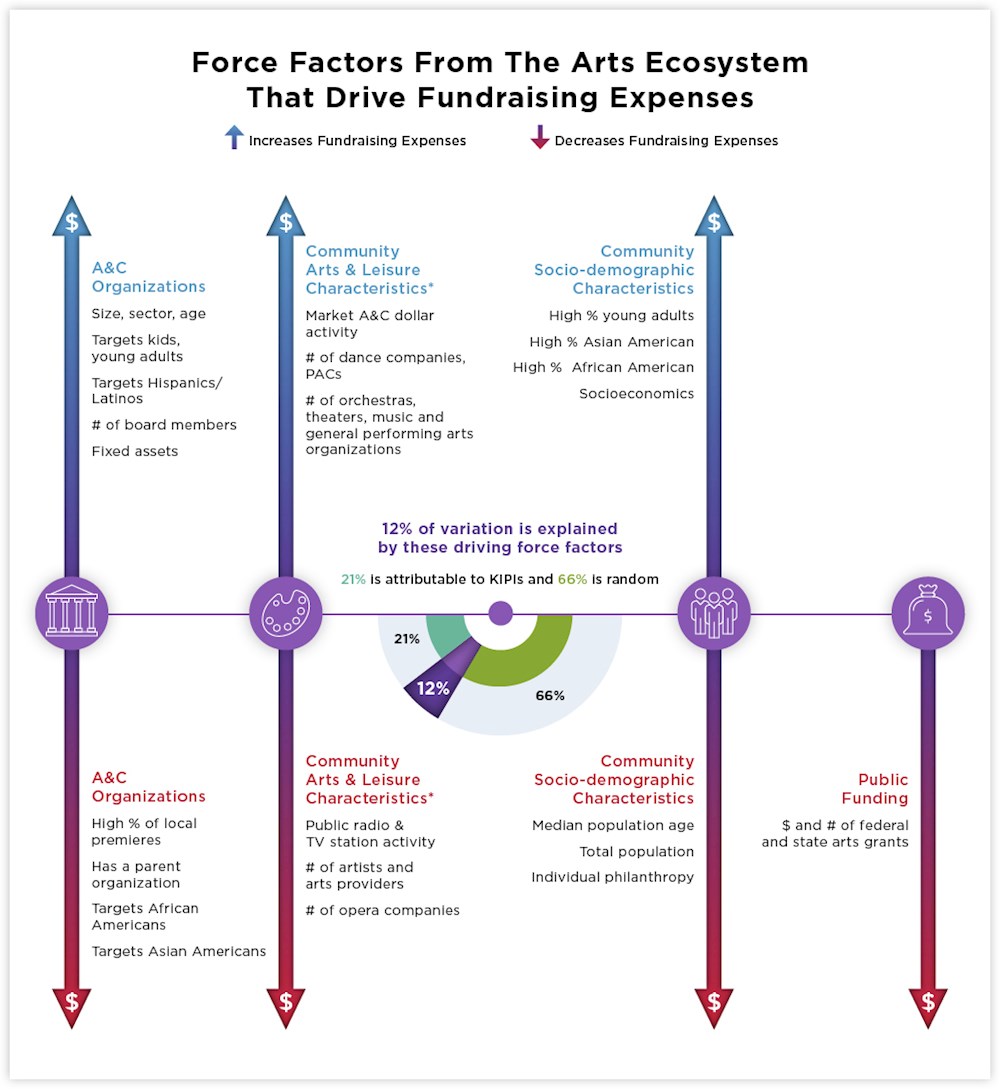
What organizational characteristics affect this performance?
- Fundraising expenses increase with sector, organizational age, budget size, a larger board and a higher level of fixed assets. Fundraising expenses also tend to be relatively higher for organizations that target people under 25- kids/young adults and Hispanics/Latinos.
- When organizations target African Americans and Asian Americans, the fundraising expense levels tend to be lower. The same is true for organizations that have a parent organization and high percentage of local premieres.
How do community arts and leisure characteristics affect performance?
- Fundraising expenses tend to be higher for organizations in communities with higher levels of total arts dollar activity. Having more dance companies, orchestras, theaters, performing arts centers, music and general performing arts organizations in a community tends to raise the spend on fundraising for all organizations in these sectors in the market.
- The more opera companies competing in market drives down the fundraising spend for all organizations in this sector. In other words, more intense competition leads organizations in this sector to spend less on fundraising.
- More public broadcast activity in a market tends to drive down arts and cultural organizations’ fundraising expense levels, as does the presence of more artists and arts providers in the community.
How do socio-demographic characteristics of the community affect performance?
- Fundraising expenses are higher for organizations in communities with higher percentage of young adults, Asian Americans and African Americans. Also, the fundraising expense level tends to be higher in places with elevated socio-economics.
- On the flip side, the fundraising expenses tend to be lower in communities with higher total population and median age. The increased individual philanthropy also lowers the spend on fundraising.
What impact does public funding have on performance?
- Where there is higher overall state and federal grant activity in the local marketplace, organizations tend to spend less on fundraising expenses.
We are able to explain one-third of the variation in fundraising expenses (including personnel). The rest is random.
Fundraising expense allocations may attract somewhat less attention and focus in terms of organizational objectives, leading to higher levels of random variation and lower levels of intellectual capital developed by organizations. Just 21% is attributable to expertise in establishing and managing the level of total expenses and another 12% of the variation in fundraising expenses is explained by the factors from the arts and cultural ecosystem. Does your organization allocate resources and effort to careful analysis of what fundraising resources are necessary given revenue objectives or return on fundraising? Or do you allocate a fixed amount or fixed percentage to fundraising efforts each year?