The 2020 Key Findings
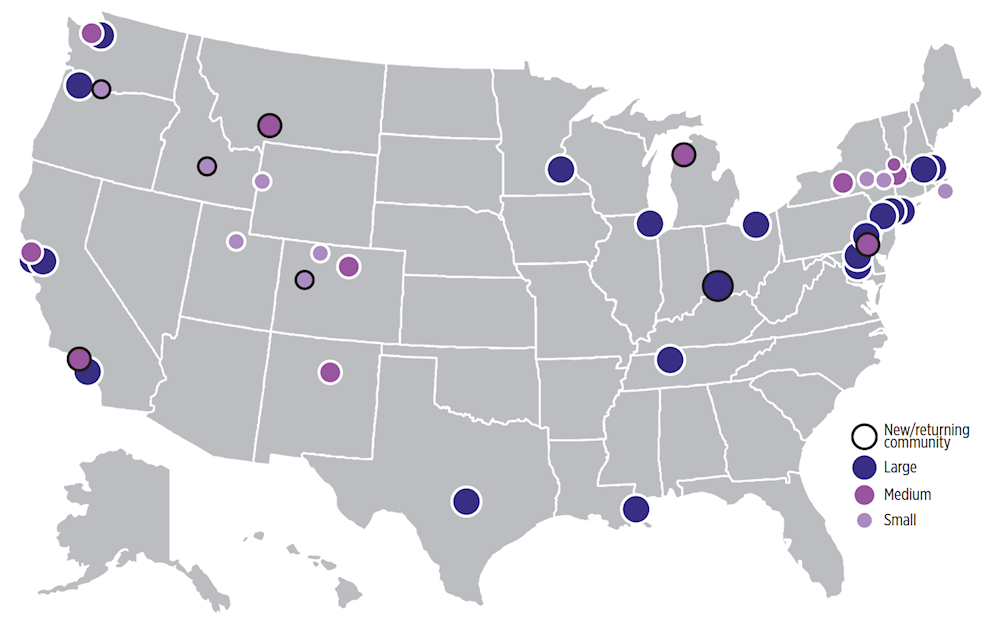
- No part of the country has cornered the market on arts vibrancy. Every region of the country has vibrant arts communities that appear in this report (see Figure 1 and Tables 1, 2, and 3). This finding arises naturally out of objective analysis of the data, not from hand selection of communities to achieve geographic representation. Large and medium metropolitan areas are represented in all regions of the country, whereas the list of small communities is dominated by those located in the West (Colorado, Idaho, Oregon, Utah, Wyoming) and Northeast (Massachusetts, New York, Vermont).
- Very large metropolitan statistical areas (MSAs) experience vibrancy through high concentration or extensive dispersion of arts and culture. Some large MSAs feature a strong concentration of arts vibrancy in the urban core with less going on in outlying districts whereas others feature vibrancy that is dispersed throughout the metropolitan area. Concentration versus dispersion of people and organizations is important to consider given the influence that distance has on attendance.[5]
- Arts vibrancy continues to take many shapes. Some top Arts-Vibrant Communities have a profusion of smaller and mid-sized organizations and venues; others have a concentration of large nonprofit arts and cultural institutions and little else; some benefit from their close proximity and ties to another arts-vibrant community; and others are artist magnets or tourist destinations. Numerous arts sectors flourish in some communities, while other cities are known for their strength in a particular art form, which emerges through the data.
- A community’s arts vibrancy is dynamic, but changes tend to be evolutionary, not revolutionary. New communities made the list this year, and there is reshuffling in the rankings of communities that made the list in prior years. Ten percent of the communities are entirely new to our lists this year, while another 10 percent return after not being included in the 2019 report.
- Hailey, ID, a small community, made the list for the first time. Hood River, OR, and Glenwood Springs, CO, reappear on the small community list following a hiatus. Jackson, WY-ID, Bennington, VT, and Heber (formerly Summit Park), UT, have made the list every year since 2015.
- Two new medium communities are on this year’s top-10 list of medium communities – Wilmington, DE-MD-NJ, and Oxnard-Thousand Oaks-Ventura, CA. Santa Fe, NM, San Rafael, CA, and Pittsfield, MA, have appeared on the list of top communities every year since 2015, while Bozeman, MT, and Traverse City, MI, reappear after a hiatus.
- One new community made our top-20, large metropolitan area list for the first time: Cincinnati, OH-KY-IN. Fourteen large communities have made the list every year since 2015, although their rankings have shifted over time.
Fluctuations in the rankings occur from year to year for several reasons:
- A community’s arts and cultural scene may have experienced the opening of an arts district or closing of a performance space. Next year’s Arts Vibrancy Index Report will no doubt reveal a changed landscape due largely to the coronavirus’ impact on organizations’ ability to open their doors.
- Because we calculate the measures on a per capita basis, it could be that growth in arts and culture was on a different trajectory than that of the total population. For instance, a city experiencing a high influx of new residents will drop in the rankings if the area’s supply and demand for the arts and inflow of state and federal grants for the arts do not increase at a commensurate level.
- We added a cost-of-living adjustment to all financial metrics in order to level the playing field, and the cost of living changes in communities over time. The cost of doing business varies based on local conditions, so the same dollar goes further in some communities than others.
- We continue to incorporate fresh data and learn about the role of distance, how concentration versus dispersion of arts organizations and people factors in, and the extent to which a community’s arts and cultural activity attracts or implicates its neighboring community members who commute as attendees or employees, for example.[6] This has led us to make adjustments to our calculations every year.
FIGURE 1: Top 40 Arts-Vibrant Communities, by Location and Size
| RANK | MSA (*= METRO DIVISION) |
REGION | 2019 POPULATION |
|
1 |
New York-Jersey City-White Plains, NY-NJ* |
Northeast |
11,834,851 |
|
2 |
San Francisco-Redwood City-South San Francisco, CA* |
West |
1,648,122 |
|
3 |
Los Angeles-Long Beach-Glendale, CA* |
West |
10,039,107 |
|
4 |
Washington-Arlington-Alexandria, DC-VA-MD-WV |
South |
4,970,252 |
|
5 |
Nashville-Davidson-Murfreesboro-Franklin, TN | South | 1,934,317 |
|
6 |
Boston, MA* |
Northeast |
2,031,884 |
|
7 |
Newark, NJ-PA* |
Northeast |
2,167,829 |
|
8 |
Minneapolis-St. Paul-Bloomington, MN-WI |
Midwest |
3,640,043 |
|
9 |
Silver Spring-Frederick-Rockville, MD* |
South |
1,310,235 |
|
10 |
New Orleans-Metairie, LA |
South |
1,270,530 |
|
11 |
Philadelphia, PA* |
Northeast |
2,150,811 |
|
12 |
Cambridge-Newton-Framingham, MA* |
Northeast |
2,400,733 |
|
13 |
Cleveland-Elyria, OH |
Midwest |
2,048,449 |
|
14 |
Oakland-Berkeley-Livermore, CA |
West |
2,824,855 |
|
15 |
Chicago-Naperville-Arlington Heights, IL |
Midwest |
7,122,725 |
|
16 |
Seattle-Bellevue-Everett, WA |
West |
3,074,865 |
|
17 |
Portland-Vancouver-Hillsboro, OR-WA |
West |
2,492,412 |
|
18 |
Austin-Round Rock, TX |
South |
2,227,083 |
|
19 |
Nassau County-Suffolk County, NY |
Northeast |
2,833,525 |
|
20 |
Cincinnati, OH-KY-IN |
Midwest |
2,221,208 |
TABLE 2: Top 10 Arts-Vibrant Medium Communities (MSAs with population under 100,000)
| RANK | MSA (*= METRO DIVISION) | REGION | 2018 POPULATION |
|
1 |
Santa Fe, NM |
West |
150,358 |
|
2 |
San Rafael, CA* |
West |
258,826 |
|
3 |
Pittsfield, MA |
Northeast |
124,944 |
|
4 |
Ithaca, NY |
Northeast |
102,180 |
|
5 |
Boulder, CO |
West |
326,196 |
|
6 |
Wilmington, DE-MD-NJ |
South |
723,993 |
|
7 |
Bozeman, MT |
West |
114,434 |
|
8 |
Oxnard-Thousand Oaks-Ventura, CA |
West |
846,006 |
|
9 |
Bremerton-Silverdale, WA |
West |
271,473 |
|
10 |
Traverse City, MI |
Midwest |
150,653 |
Table 3: Top 10 Arts-Vibrant Small Communities (Micropolitan Areas)
| RANK | MSA | REGION | 2018 POPULATION |
|
1 |
Jackson, WY-ID |
West |
35,606 |
|
2 |
Steamboat Springs, CO |
West |
25,638 |
|
3 |
Heber, UT |
West |
76,236 |
|
4 |
Hailey, ID |
West |
24,127 |
|
5 |
Glenwood Springs, CO |
West |
77,828 |
|
6 |
Vineyard Haven, MA |
Northeast |
17,332 |
|
7 |
Oneonta, NY |
Northeast |
59,493 |
|
8 |
Hudson, NY |
Northeast |
59,461 |
|
9 |
Bennington, VT |
Northeast |
35,470 |
|
10 |
Hood River, OR |
West |
23,382 |
Introduction
Arts and cultural organizations do not operate in a vacuum. They are inextricably tied to their communities. SMU DataArts recognizes this and combines data from nonprofit arts and cultural organizations with data for the communities in which they reside.[i] By geolocating organizations and linking them to their community’s characteristics in the data, we can identify factors that affect the health and sustainability of arts organizations. We know from our research that each of the factors from the ecosystem included in this report has an influence on a variety of financial, operating, and attendance outcomes for arts and cultural organizations. We share our findings regarding the operating and community characteristics that drive performance – and how they affect performance – in our quarterly reports (see, for example, The Earned Revenue Report).
Given the symbiotic relationship between arts organizations and their communities, the Arts Vibrancy Index (AVI) can help arts leaders, businesses, government agencies, funders, and engaged citizens understand the overall intensity and capacity of the community’s arts and culture sector. Past AVI reports have helped communities get the recognition they deserve from their mayors, city council members, and state legislators. Arts leaders have informed us that they use the AVI reports and interactive map on our website to consider where to relocate their operations and what markets are ripe for touring performances or exhibitions. Communities can benchmark themselves against an aspirational set of communities and understand what sets them apart by examining the underlying dimensions of demand, supply, and public support for arts and culture. Numerous funders have engaged with the AVI data to better understand how investments to increase arts vibrancy might be best directed in the communities they serve, given existing strengths and opportunities for improvement. The AVI’s multidimensional framework provides insights as to why two cities that seem very different on the surface might be close to one another in the ranking.
There are valuable frameworks that chronicle a neighborhood’s cultural resources such as the Social Impact of the Arts Project’s Cultural Asset Index, the National Endowment for the Arts’ Exploring Our Town Projects, and the Baltimore-focused interactive tool GeoLoom. There are published rankings that assess the strength of arts and culture as part of a larger look at a city’s attractiveness and livability, and others that focus on the arts and cultural sector’s role as part of creative placemaking. We share some metrics with these other studies and tools but, in keeping with SMU DataArts’ mission, our ranking focuses solely on arts and culture with heavy emphasis on the nonprofit sector.
The measures are drawn from a review of the existing literature on arts and culture indicators and from our Model of the Arts & Culture Ecosystem (see Figure 2), which features a complex and interdependent set of relationships among: 1) artists and arts organizations; 2) their communities; and 3) government funding that influences the production and consumption of arts and culture.
FIGURE 2: Modeling the Arts & Culture Ecosystem
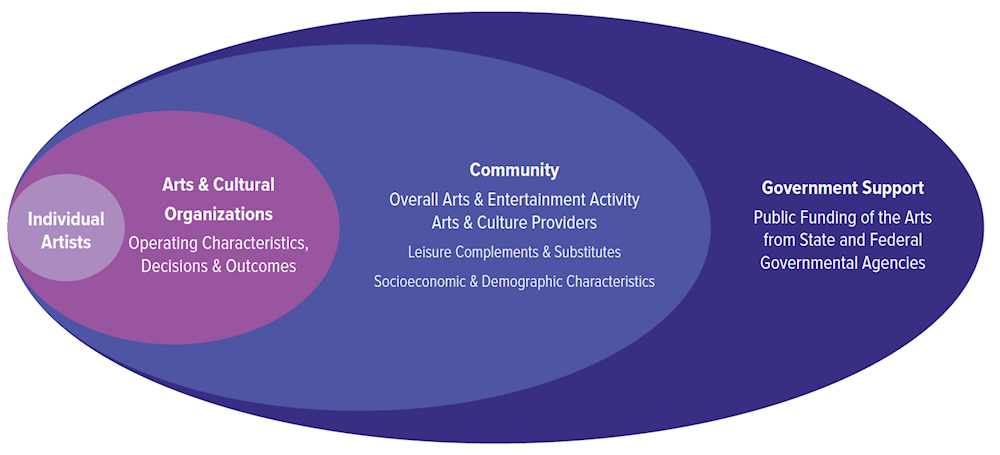
When we look at factors that affect the performance of arts and cultural organizations in our quarterly reports and in the Arts Vibrancy Map online, we include socioeconomic and demographic characteristics and other leisure activities like cinemas, professional sports teams, and zoos. We have intentionally omitted these factors from the AVI Report in order to focus the rankings as purely as possible on arts and cultural activity. It would be inequitable, for example, to penalize a community that is relatively low on per capita income but very strong on arts providers, or to elevate a community that has a relatively high number of professional sports teams and restaurants but few artists or arts organizations.
KEY DEFINITIONS
We aggregate measures across the 12 arts and cultural sectors that are included in SMU DataArts’ research and KIPI Dashboard: Arts Alliances and Service Organizations, Arts Education, Art Museum, Community, Dance, Music, Opera, Performing Arts Center, Symphony Orchestra, Theater, Other Museum, and Multidisciplinary Performing Arts.[ii] Some sectors combine arts and cultural disciplines with similar characteristics (e.g., Other Museums includes History Museums, Natural History & Natural Science Museums, and Science & Technology Museums, etc.).[iii]
Communities are defined by the Office of Management and Budget (OMB) as MSAs, or Micro- and Metropolitan Statistical Areas. As described on the OMB website:
“Metropolitan Statistical Areas have at least one urbanized area of 50,000 or more population, plus adjacent territory that has a high degree of social and economic integration with the core as measured by commuting ties.
Micropolitan Statistical Areas have at least one urban cluster of at least 10,000 but less than 50,000 population, plus adjacent territory that has a high degree of social and economic integration with the core as measured by commuting ties.”[7]
Micro- and Metropolitan Statistical Areas are comprised of one or more counties. For this reason, readers will find descriptions of countywide activity in the latter half of this report. The OMB is careful to point out that, since MSAs encompass entire counties, they do not equate to an urban-rural classification since many counties hold both rural and urban characteristics.[8]
The Census Bureau and other government agencies use MSAs when collecting, organizing, and analyzing data. Focusing on MSAs provides a nationally standardized, objective approach to delineating markets. MSAs are frequently centered on one large city or twin cities, but they capture the network of suburbs that rise up around a city or town rather than considering them separately. A key feature, as quoted above, is the “high degree of social and economic integration with the core as measured by commuting ties.”
For some, the notion of MSAs feels off target because they think about the character of their city in very different terms than they do that of surrounding suburbs or the rest of the county. And yet visitors, audience members, artists, and employees of arts organizations live in the surrounding suburbs, particularly when real estate prices make living in the urban core cost-prohibitive. Off-site production facilities and storage are frequently located in less expensive parts of town that may or may not fall within the city’s official boundaries. Main airports often lie outside of the city limits and yet they serve arts and cultural organizations in the city through air transportation of artists, visitors, and materials. For these reasons, the OMB’s approach has practical implications for arts and cultural ecosystems.
Where the OMB breaks down very large MSAs with populations over 2.5 million into Metropolitan Divisions, we do the same. Metropolitan Divisions function as distinct social, economic, and cultural areas within the larger MSA, kind of like MSAs within MSAs.9 To keep consistent across all analyses, we go with Metropolitan Divisions where they exist and note the comparisons with MSAs and with other Metropolitan Divisions for the same MSA. In total, there are 947 unique MSAs and Metro Divisions in the U.S.
Although all measures are calculated on a per capita basis to examine as level a playing field as possible, we report rankings on cities in three size categories rather than compare cities of vastly different size: Large MSAs (and Metro Divisions) with populations over 1,000,000; Medium MSAs (and Metro Divisions) with populations of 100,000 to 1 million; and Small MSAs, all of which are Micropolitan Statistical Areas. Taking a per capita approach, and capturing the activity of MSAs rather than cities (i.e., urban cores only), sometimes leads to surprising results.
Metrics and Measures
With this report, our goals are to provide information about metrics that are meaningful and consequential, and to stimulate a conversation about how cities vary in their arts vibrancy and the forms vibrancy can take. Arts Providers are a gauge of supply and include the number of independent artists, arts and culture employees, nonprofit arts and cultural organizations, and arts, culture, and entertainment firms in the community. Arts Dollars represent a gauge of demand for nonprofit arts and cultural programming, including earned revenue from program activities, contributed revenue supporting the arts, total compensation to artists and staff, and total expenses. Government grant activity is a gauge of public support for arts and culture, captured as the number of state and federal grants and total government grant dollars in the community.
Table 4 shows what we measured, the sources of data for each measure, and how we weighted each area. We weight Arts Providers and Arts Dollars more heavily than Government Support because of their critical importance to arts vibrancy, as they are indicators of supply and demand. We adjust revenue and expense figures by a cost-of-living index.
TABLE 4: Index Components (all per capita measures)[iv]
| METRIC | MEASURES | DESCRIPTION | WEIGHT |
|
Arts Providers |
County and ZIP code Business Pattern data collected and disseminated by the US Census Bureau. Arts and cultural organization data aggregated from IRS 990s. |
45% |
|
|
Independent artists |
Freelance artists primarily engaged in performing in artistic productions, in creating artistic and cultural works or productions, or in providing the technical expertise necessary for these productions, aggregated at the zip code level |
||
|
Arts and culture employees |
Number of people employed by the museum, historical site, theater, dance, music, opera, and other performing arts sectors, as salaried employees or independent contractors, aggregated at the county level |
||
|
Arts and cultural organizations |
Number of nonprofit organizations in the museum, arts education, community, dance, music, opera, performing arts center, orchestra, theater, multidisciplinary performing arts, or arts alliance and service organization sectors, aggregated at the zip code level |
||
|
Arts, culture & entertainment firms |
Number of arts, culture, and entertainment firms, weighted for size and aggregated at the zip code level. Includes museums, theaters, dance companies, opera companies, music groups and performers, music producers and presenters, fine arts schools, and recording, motion picture, and video production companies |
||
|
Arts Dollars |
Data aggregated from IRS 990s, SMU DataArts’ Cultural Data Profile, and Theatre Communications Group |
45% |
|
|
Program revenue |
All revenue earned due to people participating in the activities of nonprofit arts and cultural organizations* |
||
|
Contributed revenue |
All revenue from contributions to nonprofit arts and cultural organizations (includes public funding)* |
||
|
Total expenses |
All expenses of nonprofit arts and cultural organizations* |
||
|
Total compensation |
All payment to staff and artists by nonprofit cultural organizations* |
||
|
Government Support |
Data collected and disseminated by the National Endowment for the Arts, Institute of Museum and Library Services, and National Assembly of State Arts Agencies |
10% |
|
|
State arts dollars |
All state arts dollar funding in the community* |
||
|
State arts grants |
Number of state arts grants awarded in the community |
||
|
Federal arts dollars |
All NEA and IMLS dollar funding in the community* |
||
|
Federal arts grants |
Number of NEA and IMLS grants awarded in the community |
*Adjusted by a cost-of-living index
Because there are 947 unique MSAs and Metro Divisions, any ranking between 1 and 95 still puts that community in the top 10% of cities on that measure, and a ranking of 96-190 means the community is in the top 20th percentile, etc. Being ranked in the top 10 roughly means being in the top 1%.
Rankings are ordinal measures – i.e., who came in 1st, 2nd, 3rd, etc. This provides the order of the results but no information about the degree of difference between the raw measures. This is an important distinction to keep in mind. For example, the community ranked 1st on independent artists might feature a population that is 10% independent artists while the 2nd place community has only 5% of the population who are independent artists and the 3rd place community has 4.7% independent artists. The degree of difference between cities 1 and 2 is much bigger than the difference between cities 2 and 3, and yet the ranking makes them appear to be evenly spread apart. This is why the overall arts vibrancy ranking is not an average of the rankings on the three component metrics and the three component metrics are not an average of the rankings on their underlying measures.v We don’t average rankings, we average raw scores.