Conclusion
This year’s Arts Vibrancy Index Report is a celebration of the variety of ways that the arts contribute to the character of a place and the people who live there. The severe effects of the coronavirus on arts and cultural organizations, their employees, the artists whom they hire and whose work they present, and the communities they serve have been felt since March 2020. Many organizations have already made the decision to postpone reopening plans until 2021. The landscape of the nation’s arts and culture field for the year 2020 will no doubt be a considerable departure from that of 2019. It is important, however, not to forget how the arts can make a community pulsate with life, vigor, and activity. This report serves as a reminder that communities that value arts and culture invest in it, and those investments are reflected in the number of Arts Providers, the Arts Dollars, and the level of Government Support secured from state and federal sources. These 40 communities each have their own unique character, as do all counties across the country. To see the strengths of your county and potential areas of growth, visit The Arts Vibrancy Interactive Map.
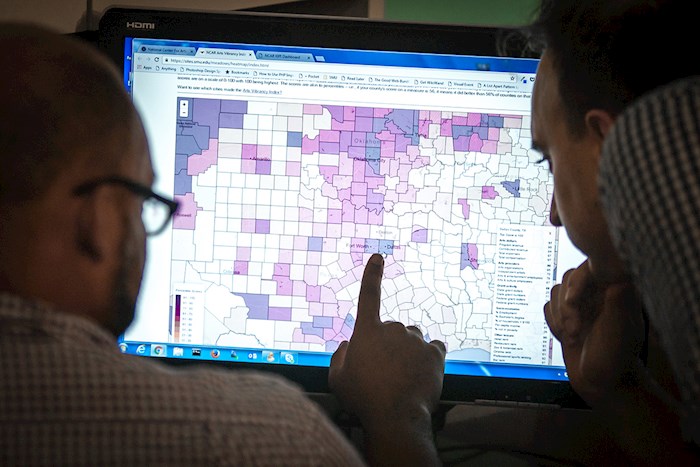
The Map: Scores for Every County in America
What factors make up a community's arts vibrancy, and which cities possess them? We provide scores for every county's Arts Dollars, Arts Providers, Government Support, Socio-economic and Other Leisure characteristics. This way, when you read in the SMU DataArts report how these community characteristics drive performance, you can also see your community's relative strength on each characteristic. The scores are on a scale of 0-100 with 100 being highest. The scores are akin to percentiles - i.e., if your county's score on a measure is 56, it means it did better than 56% of counties on that measure.
ENDNOTES
i The data that SMU DataArts has integrated for this report comes from numerous Organizational data that forms the basis of the Arts Dollar measures is from the Internal Revenue Service, DataArts’ Cultural Data Profile, and Theatre Communications Group. Community data that forms the basis of the Arts Provider measures is from the Internal Revenue Service and the Census Bureau, which is reported by county, zip code, and census tract. State funding data is from the National Assembly of State Arts Agencies and Federal funding data is from the National Endowment for the Arts and the Institute of Museum and Library Services.
ii The 12 categories of arts and cultural sectors and their associated NTEE codes are as follows:
Arts Alliance and Service Organizations: Alliances & Advocacy (A01), Management & Technical Assistance (A02), Professional Societies & Associations (A03), Fund Raising & Fund Distribution (A12)
Arts Education: Arts Education/Schools (A25) and Performing Arts Schools (A6E)
Art Museums: Art Museums (A51)
Community: Arts and Cultural Organizations – Multipurpose (A20), Cultural & Ethnic Awareness (A23), Folk Arts (A24), Arts & Humanities Councils/Agencies (A26), Community Celebrations (A27), Visual Arts (A40)
Dance: Dance (A62) and Ballet (A63)
Music: Music (A68), Singing & Choral Groups (A6B), and Bands & Ensembles (A6C)
Opera: Opera (A6A)
Performing Arts Centers: Performing Arts Centers (A61) Symphony Orchestra: Symphony Orchestras (A69) Theater: Theater (A65)
Other Museums: Museums & Museum Activities (A50), Children’s Museums (A52), History Museums (A54), Natural History & Natural Science Museums (A56), and Science & Technology Museums (A57)
Multidisciplinary Performing Arts: Performing Arts (A60)
iii We assign organizations to arts sectors using the National Taxonomy of Exempt Entities (NTEE), which is a classification system for nonprofit organizations. The NCCS website gives an excellent summary description of what NTEEs are and how they came about: http://nccs.urban.org/classification/NTEE.cfm. Organizations report their NTEE when filing their IRS 990 and they report it as part of DataArts’ Cultural Data Profile survey. If an organization has a parent organization, we opted for its arts discipline NTEE (e.g., performing arts center) rather than its parent organization’s NTEE (e.g., university) if “Arts and Culture” is one of the NTEE’s 10 major groups of tax-exempt organizations (the “A” category), and within Arts and Culture there are 10 subcategories that contain 30 additional subdivisions.
iv See i above
v All measures are calculated on a per capita basis, and all financial measures are adjusted for cost of To combine measures for score calculations, we standardize each metric using factor analysis. The factor analysis process applies weights to the measures based on the calculated “quality” of each measure. The weighted measures are then combined to create a standardized factor score for each of the metrics. The standardized scores have means of zero and standard deviations of one. Once the three metrics are standardized, we weight them 45% for Arts Providers, 45% for Arts Dollars, and 10% for Government Support. These weighted metrics are then added to generate the Arts Vibrancy score for a particular community. Arts Vibrancy scores for all communities are then compared to determine Top Arts-Vibrant Communities and allow for the generation of percentile-like scores as shown on the Arts Vibrancy Map.
REFERENCES
[1] ArtPlace America’s online Library for links to numerous resources, http://www.artplaceamerica.org/resources.
[2] In It for the Long Haul, SMU DataArts and TRG Arts, May 2020, https://culturaldata.org/pages/long-haul/.
[3] National Endowment for the Arts (2020), National Endowment for Arts Announces Second Round of Fiscal Year 2020 Funding, https://www.arts.gov/news/2020/national-endowmentartsannounces-second-round-fiscal-year-2020-funding. Accessed 26 June 2020.
[4] Merriam-Webster Dictionary, https://www.merriam-webster.com/dictionary/vibrant. Accessed 26 June 2020.
[5] At What Cost? How Distance Influences Arts Attendance, SMU National Center for Arts Research, October 2017.
[6] Ibid.
[7] Office of Management and Budget, OMB Bulletin No. 20-01. https://www.whitehouse.gov/wp-content/uploads/2020/03/Bulletin-20-01.pdf. Accessed 28 May 2020, page 2.
[8] Office of Management and Budget, OMB Bulletin No. 20-01. https://www.whitehouse.gov/wp-content/uploads/2020/03/Bulletin-20-01.pdf. Accessed 28 May 2020.
[9] Ibid.
[10] http://www.worldcitiescultureforum.com/cities/new-york. Accessed 13 July 2020.