Unrestricted Contribution Analysis Highlights
Key Findings Outlined by Sector, Size, and Market
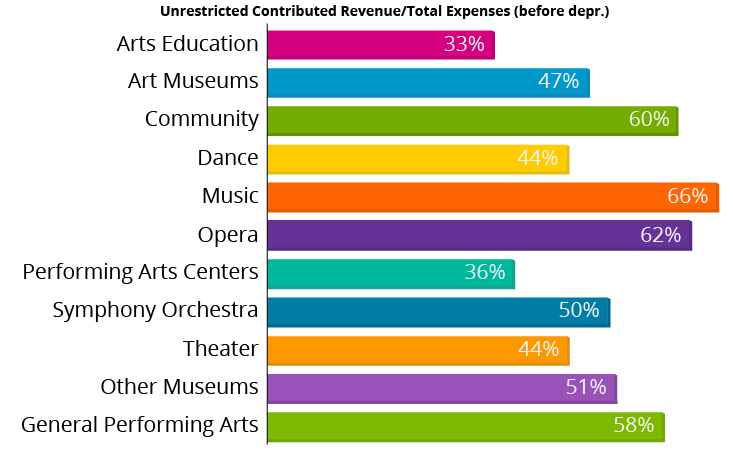
How does the unrestricted contributed revenue index compare across sectors?

- Music organizations had the highest percentage of expenses covered by contributed revenue at 66%. Unrestricted contributions covered over half of expenses for 5 out of the 11 sectors: Music, Opera, Community-based, General Performing Arts and Other Museums.
- Arts Education had the lowest percentage of expenses covered by contributed revenue at 33%, followed closely by Performing Arts Centers at 36%.
- Art Museums have the highest average unrestricted contributed revenue and average total expenses while Music organizations have the lowest average unrestricted contributed revenue and average total expenses but have the highest index level.
 Revenue mix varies considerably by sector.
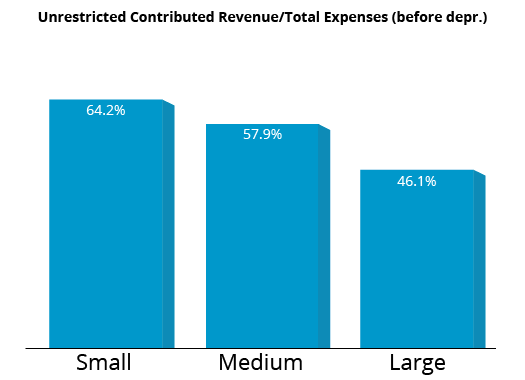
Small Organizations Covered More Expenses with Unrestricted Contributions Than Medium or Large Organizations
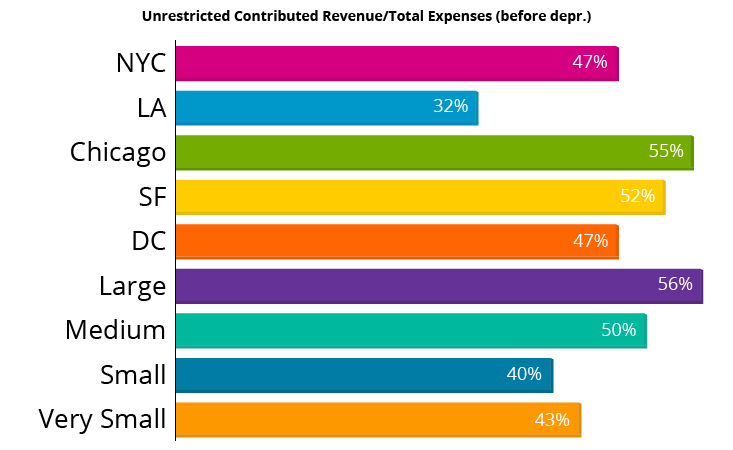
New York Organizations Had the Highest Level of Contributed Revenue

- Organizations in Chicago, San Francisco, and Large markets covered more than half of their expenses with unrestricted contributed revenue, whereas the reverse was true for all other markets.
- Arts organizations in the Los Angeles area had the lowest contributed revenue relative to expenses at 32% followed by Small markets at 40%.
- New York organizations had the highest average unrestricted contributed revenue – more than double that of any other market -- while Los Angeles organizations had the lowest.
- Even though New York organizations’ average contributed revenue and total expenses are much higher than those of Chicago organizations, their unrestricted contributed revenue index level is same at 47%.
