What Drives Unrestricted Contributed Revenue?
Driving Forces
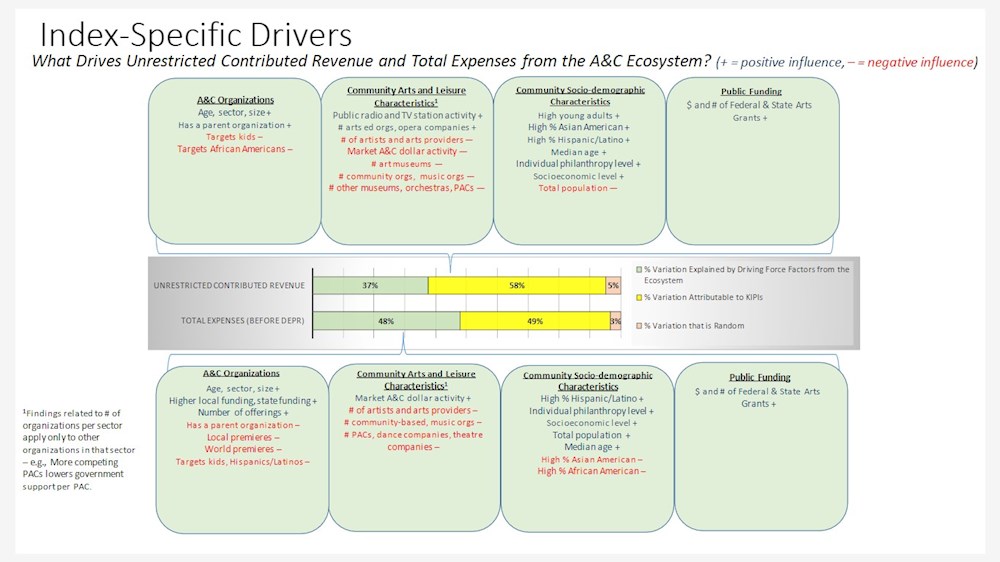
What Drives Unrestricted Contributed Revenue?
What organizational characteristics affect this performance?
- Unrestricted contributions increase with organizational age and with budget size for organizations in each sector. Unrestricted contributed revenue is higher for organizations that have a parent/sheltering organization.
- When organizations target kids or African Americans, unrestricted contributed revenue tends to be lower.
How do community arts and leisure characteristics affect performance?
- More public broadcast activity tends to drive higher unrestricted contributions for arts and cultural organizations.
- Unrestricted contributed revenue tends to be lower for organizations in communities with higher levels of total number of artists and arts providers, as well as in communities with higher levels of total arts dollar activity.
- The more arts education organizations and opera companies in a market, the higher unrestricted contributions for organizations in those sectors.
- Having more organizations that compete in the museum, music, community, orchestra, PAC, sectors drives down unrestricted contributed revenue for all organizations in these sectors.
How do socio-demographic characteristics of the community affect performance?
- Unrestricted contributed revenue is higher for organizations in communities with higher socioeconomic levels, higher median age in the population, and where the percentage of the population that is 18-25, Hispanic/Latino or Asian American is higher.
- Not surprisingly, unrestricted contributions for arts and cultural organizations are higher in communities that are more philanthropic overall.
- As the population size increases unrestricted contributed revenue goes down.
What impact does cultural policy have on performance?
- Overall state and federal grant activity in the larger local marketplace has a positive effect on an individual organization’s unrestricted contributed revenue.
What Drives Total Expenses?
What organizational characteristics affect this performance?
- Expenses increase with sector, organizational age, budget size, higher levels of local and state funding, and more programmatic offerings.
- When organizations have a parent organization, target kids or Hispanics/Latinos, or offer a higher level of local or world premieres, expenses tend to be lower.
How do community arts and leisure characteristics affect performance?
- Expenses tend to be higher for organizations in communities with higher levels of total arts dollar activity.
- Organizations tend to have lower expense levels when there is a high number of arts providers and artists in the community.
- Having more organizations that compete in the community-based, music, PAC, dance, and theatre sectors drives down expenses for all organizations in these sectors. In other words, the competition makes it more difficult for organizations in these sectors to grow in budget size.
How do socio-demographic characteristics of the community affect performance?
- Total expenses are higher for organizations in more densely populated communities and communities with a higher median age in the population, those with a higher socioeconomic level and higher level of overall individual philanthropy, and where the percentage of the population that is Hispanic/Latino is higher.
- Communities with proportionally more Asian Americans or African Americans tend to have smaller-budget arts organizations.
What impact does cultural policy have on performance?
- Higher overall state and federal grant activity in the local marketplace has no effect on total expenses.