Highlights from Our By-Sources Study
Key Findings by Sector, Size, and Market
Where The Money Comes From Across Arts Sectors
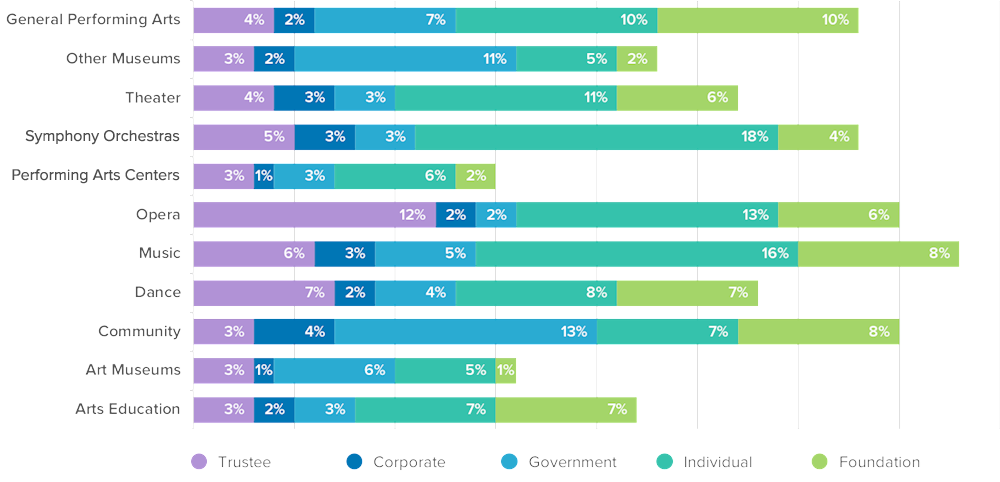
The indices presented here for these 5 important contributed revenue sources reflect only the gifts made in the current year for use in the current year. The combined level of expenses supported by these five sources is quite different from sector to sector, ranging from 15% (PACs) to 37% (Music). No sector was similar to another in terms of distribution of support across funding sources.
- The number of board members and trustee contributors varies across sectors (not shown). The community, dance and music sectors each average 10-11 board members with 85% to 90% of trustees donating. The largest boards are seen in Art Museums and Opera. Art Museums average 26 board members with 94% of trustees donating, while Opera companies average 22 board members with 95% of trustees donating.
- Trustee contributions support an average of 3% -4% of expenses for all but the Dance, Music, Opera, and Orchestra sectors. Operas have the highest Trustee Contribution Index at 12%.
- Music, Opera, Symphony Orchestras, and Other museums have higher Individual Contributions Indices than other sectors.
- The Art Museum sector averages nearly 2 times the number of individual donors as Other Museums, the next highest sector: 2191 and 1041, respectively. Arts Education, Community, Dance and General Performing arts sectors average 225-280 donors. Music, the sector with lowest average expenses, had the lowest number of individual donors at 166 donors. PACs and Opera companies averaged 1000 and 948, respectively, while Symphony Orchestras were at 596 and Theaters at 549.
- Corporate support maxes out at an average of 4 % of total expenses for all sectors.
- The two museum sectors report the largest average number of corporate contributors: 29 for Art Museums and 34 for Other Museums. PACs average 22 corporate donors, Orchestras and Opera average 14-15 and Arts Education 12, while all other sectors have 4-8 corporate donors annually.
- Foundation contributions support an average of 6% -8% of expenses for all but the Art Museum, PAC, Orchestra, Other museum, and General Performing Arts (GPA) sectors. GPAs have the highest Foundation Support Index at 10% whereas Art Museums have the lowest at 1%, despite the fact that the average Arts Museum attract funds from more foundations than organizations in other sectors.
- The Community-based, Art Museums and Other Museum sectors have higher Government Support Indices than other sectors whereas Opera has the lowest. Average local government support comprises more than half of all government funding for all sectors. For art museums, 86% comes from local government, followed closely by Community-based organizations where 71% comes from local government.
- Our figures under-represent the bigger picture of support from trustees, individuals, corporations, foundations, and government that includes not only gifts made this year for use this year but also gifts made in a prior year for use this year, and gifts of materials, services and facilities. Net assets given in a prior year and released into 2017 accounted for 36% of 2017 total unrestricted contributed revenue.
Comparing the Averages on Small, Medium, and Large Organizations
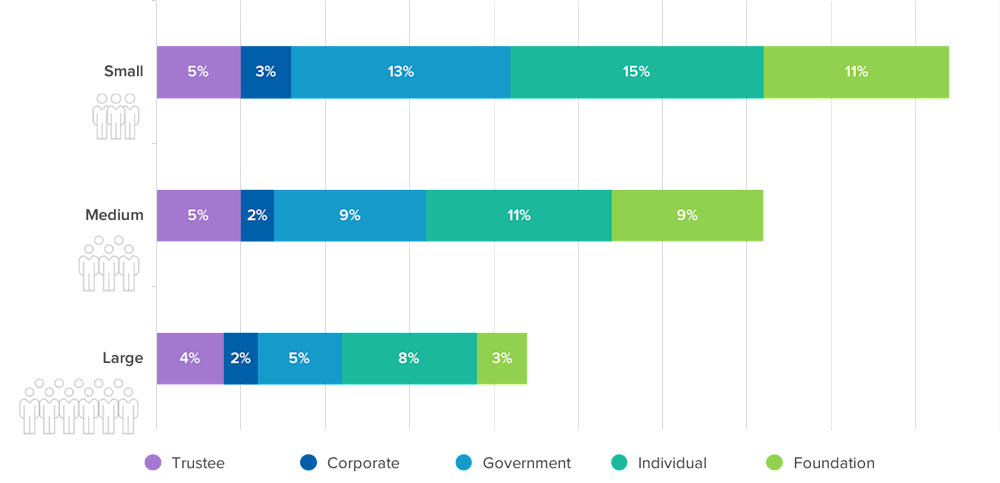
Small and Medium organizations tend to cover more than half of expenses with contributed revenue but it’s not the same case for Large organizations where less than half of the expenses are covered by unrestricted contributed revenue. : 64.2% for Small organizations, 57.9% for Medium and 46.1% for Large (not shown in chart; see the Unrestricted Contributions Index). However, the larger the organization: 1) the more diverse its portfolio of contributed revenue; 2) the less reliant it is on cash contributions from these five sources given in the current year for the current year’s activities; and 3) the better able it is to do multi-year planning and attract funding now for future projects.
Large organizations cover 22% of expenses with contributions made this year for this year’s projects and another 19% with net assets released from restriction (NARR) – i.e., gifts made in a prior year for this year’s projects. By contrast, Small organizations cover 47% of expenses with current year gifts and 3% with NARR while Medium organizations support 36% of expenses with current year gifts and 12% with NARR. The remainder of funding for all size organizations comes from in-kind giving, tribal contributions, fundraising events, united arts funds, and parent organizations. Our index figures under-represent the bigger picture of support from trustees, individuals, corporations, foundations, and government that includes not only gifts made this year for use this year, but also gifts made in a prior year for use this year, and gifts of materials, services and facilities.
- Trustee contributions support 4%-5% of total expenses and corporate support covers 2%-3% of expenses, regardless of an organization’s size.
- The smaller the organization the higher the average Individual, Foundation, and Government Support Indices.
- For the average organization, more than half of government funding -- between 55%-71% -- was at the local level for organizations of every size. Small organizations received 40% funding from their state and 4% from federal sources. For Medium, state provided 27% and federal 9% and for Large organizations, state and federal funded about the same 14%-15% of total government support (not shown in table).
Comparing Support in Markets Across the Country
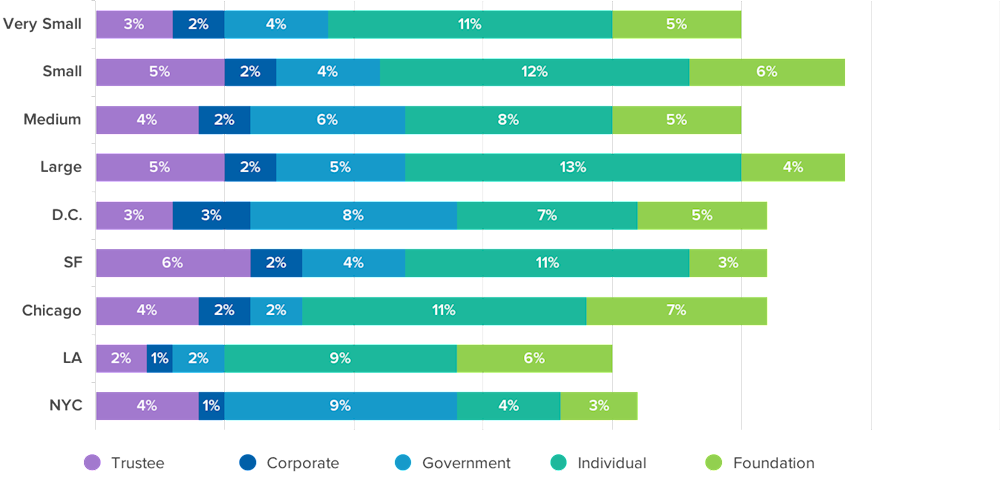
The indices presented here for these 5 important contributed revenue sources reflect only the gifts made in the current year for use in the current year. The combined level of expenses supported by these five sources is quite different from market to market, ranging from a low of 21% in New York to a high of 29% in Large Markets.
- The number of board members varies across markets, too (not shown). L.A. and San Francisco organizations averaged 10 board members, the fewest among markets, while Medium Markets averaged 14 board members, the highest. Board participation in giving averaged 89% to 91% in all markets.
- Trustee contributions support an average of 4%-5% of expenses for most markets, with the highest trustee contributions index levels in San Francisco at 6% (elimination of an outlier would leave it at 5%) and lowest in Los Angeles at 2%.
- Average expenses for New York organizations were nearly 3 times higher than those of San Francisco, the next highest market. Eliminating an outlier in New York still leaves average expenses 2 times higher than any other market for remaining organizations. Organizations in Very Small Markets had the lowest average expenses, followed by those in Small Markets and L.A.
- Chicago, San Francisco, Large, Small, and Very Small Markets had higher Individual (non-trustee) Contributions Indices whereas New York had the lowest.
- New York organizations averaged nearly twice the number of individual donors as Medium Markets, the next highest: 883 and 468, respectively. Organizations in Chicago, San Francisco, Very Small, Small and Larger Markets average 300-400. Los Angeles and DC markets average 250-300.
- Corporate support maxes out at an average of 2% of total expenses for all markets except DC, where the Corporate Contributions Index is at 3%. New York boasts the highest average number of corporate donors at 12 while Los Angeles has the lowest average number of corporate support at 4. This is not surprising given what we know about the average number of corporate donors for organizations based on budget size, and the average budget size of organizations in these two markets.
- Organizations in Chicago averaged the highest Foundation Support Index at 7%, followed by L.A. and Smaller Markets. Organizations in San Francisco and New York averaged the lowest level of expenses covered by foundation support both granted and used in the current year.
- Despite the fact that its Foundation Support Index is comparable to most other markets, New York organizations averaged 13 foundation grants, almost twice that of any other market. Chicago, Medium and Small markets all averaged 8-9 foundation grants per organization, while L.A., San Francisco, D.C., Larger and Very Small Markets averaged 5-6 foundation grants.
- New York had the highest government support index at 9%, followed by D.C. at 8% and Medium markets at 6%. L.A. and Chicago had the lowest government support index at 2%. Organizations in NYC average 3 government grants whereas all other markets have an average of 2 government grants.
- Local government makes the biggest portion of the government funding for all markets except Very Small markets where State makes the largest portion of government support. Federal contributes the least in Chicago, DC, Larger, Medium, Small and Very Small markets.
- Our figures under-represent the bigger picture of support from trustees, individuals, corporations, foundations, and government that includes not only gifts made this year for use this year but also gifts made in a prior year for use this year and gifts of materials, services and facilities. Net assets donated in a prior year but released into 2017 budgets accounted for a low of 20% of total unrestricted contributions in L.A. and a high of 41% in Larger Markets.