Research Methodology
How We Determined Sector
We examined the data to see whether some arts and cultural disciplines hold similar enough characteristics to group them together into Sectors for purposes of our analysis. For example, should all museums be studied together or are there significant enough differences to warrant a separate look at art museums versus other museums (e.g., history, science, children’s museums, etc.) in each analysis? Some sectors clustered but some stand out as unique enough to report on separately. The number of sectors and their clustering may change in future reports as we add data.
We do not assign organizations to arts disciplines, they assign themselves. Organizations self-identify according to the National Taxonomy of Exempt Entities (NTEE), which is a classification system to identify nonprofit organization types. The NCCS website gives an excellent summary description of what NTEEs are and how they came about. Organizations report their NTEE when filing their IRS 990 and they report it as part of the CDP survey. If an organization has a parent organization, we opted for their arts discipline NTEE (e.g., performing arts center) rather than their parent organization’s NTEE (e.g., university), if available. “Arts and Culture” is one of the NTEE’s 10 major groups of tax-exempt organizations (the “A” category), and within Arts and Culture there are 10 subcategories that contain 30 additional subdivisions.
We came up with 11 distinct categories of arts and cultural sectors.
• Arts Education: Arts Education/Schools (A25) and Performing Arts Schools (A6E)
• Art Museums: Art Museums (A51)
• Community: Arts, Cultural Organizations – Multipurpose (A20), Cultural & Ethnic Awareness (A23), Folk Arts (A24), Arts & Humanities Councils/Agencies (A26), Community Celebrations (A27), Visual Arts (A40)
• Dance: Dance (A62) and Ballet (A63)
• Music: Music (A68), Singing & Choral Groups (A6B), and Bands & Ensembles (A6C)
• Opera: Opera (A6A)
• Performing Arts Centers: Performing Arts Centers (A61)
• Symphony Orchestra: Symphony Orchestras (A69)
• Theater: Theater (A65)
• Other Museums: Museums & Museum Activities (A50), Children’s Museums (A52), History Museums (A54), Natural History & Natural Science Museums (A56), and Science & Technology Museums (A57)
• General Performing Arts: Performing Arts (A60)
One additional category — Miscellaneous — captures all organizations that did not fit into one of the categories above. This sector includes everything from Film Festivals to Humanities, Historical, and Arts Service Organizations.
How We Determined Size
Size matters. We would expect that small organizations face different pressures or challenges than medium-sized organizations, which in turn perform differently than large organizations.
Rather than prescribe arbitrary cut-off points for assigning organizations into small, medium, and large categories based on their total expenditures, we turned to the data to tell us the point in each sector at which performance outcomes differ depending on the organization’s budget size — i.e., where the performance change point lies. To tease this information out of the data, we analyzed unrestricted contributed revenue, total program expenses, and total in-person attendance. It turns out that arts and cultural sectors have different change points. With the addition of new data and new organizations over time, these change points may shift in future reports. Here are the budget ranges of small, medium and large, defined for — and by — organizations in each arts and cultural sector in our dataset.
The Make-up of Our 5 Years of Data:
Arts and Cultural Sectors by Size
| Arts Sector | Small | Medium | Large |
|---|---|---|---|
|
Arts Education |
$364,493 or less |
$364,494 - $2,436,552 |
$2,436,553 or more |
|
Art Museums |
$1,599,039 or less |
$1,599,040 - $14,213,117 |
$14,213,118 or more |
|
Community |
$261,495 or less |
$261,496 - $1,731,579 |
$1,731,580 or more |
|
Dance |
$211,757 or less |
$211,758 - $1,503,530 |
$1,503,531 or more |
|
Music |
$170,744 or less |
$170,745 - $969,847 |
$969,848 or more |
|
Opera |
$523,507 or less |
$523,508 - $4,888,184 |
$4,888,185 or more |
|
Performing Arts Centers |
$623,040 or less |
$623,041 - $7,999,999 |
$8,000,000 or more |
|
Symphony Orchestras |
$288,646 or less |
$288,647 - $2,436,552 |
$2,436,553 or more |
|
Theater |
$409,027 or less |
$409,028 - $3,041,233 |
$3,041,234 or more |
|
Other Museums |
$650,216 or less |
$650,217 - $4,888,184 |
$4,888,185 or more |
|
General Performing Arts |
$244,357 or less |
$244,358 - $2,150,685 |
$2,150,686 or more |
How We Determined Geographic Market Clusters
Rather than show the data for every city for which we have CDP and TCG data, we do so for 9 clusters of markets. We all have a hunch about which other markets are similar to ours, but cluster analysis allows the data to tell us what markets are similar to one another given a set of traits.
The characteristics we chose for determining similar markets were population, region, density of arts and cultural organizations in each sector, cultural policy (reflected by state grant dollars in the market), and median income in the community. This doesn’t mean that within each sector there won’t be some city-to-city variance on different traits, or that an individual organization’s experience won’t be different from that of the rest of the organizations in its market.
Five very large markets (including the combination of Washington-Arlington-Alexandria and Bethesda-Rockville) stand alone. These five are sufficiently dissimilar that they don’t cluster with any other markets. Four additional clusters of markets emerged. The composition of the market clusters will likely change over time and new clusters will emerge as we incorporate new data from organizations already in our dataset as well as data from organizations in additional states as the CDP expands its reach.
We focus on the geographic trade areas relevant to the arts and cultural organizations for which we have data. For a complete explanation on how we determined the geographic areas relevant to arts and cultural organizations in each market, see the section on Building a Spatial Model. We report on markets according to their Core Based Statistical Area (CBSA), a U.S. geographic area defined by the Office of Management and Budget. The averages we report here are for all organizations.
The population of some markets is more densely concentrated (think dense, high-rise living) than others. The fact that the population is more spread out does not necessarily mean that the city’s arts and cultural organizations are spread out. In some cases they are, but not always. For example, the numbers tell us that in Los Angeles, the population and arts organizations are more or less equally dispersed geographically and that the arts organizations in New York are more concentrated in Manhattan than the population, which spills out into the surrounding boroughs. In San Francisco, three-quarters of the total population fall into the trade area of an arts organization. What we care most about is what’s going on in the organization’s trade area.
When smaller, lower-density markets are located next to larger, higher-density markets, the spatially-adjusted population and competition numbers can be larger than the local numbers. In other words, the size of the trade area for the smaller market can exceed the size of its local market. This is true for customers but even more so for competition. Arts patrons and managers in smaller markets recognize the competition from arts organizations in nearby, larger markets. This is evident in the numbers for the very small markets like Akron, OH (40 miles from Cleveland), Ann Arbor, MI (40 miles from Detroit), and Santa Cruz, CA (30 miles from San Jose and 70 miles from San Francisco). The trade area for the typical organization in these markets features a population of 206,000 people (79% of the average population) and 41 nonprofit arts and cultural organizations (110% of the average number in the immediate market) because their trade area picks up the neighboring big city.
The Traits of the Market Clusters reveal distinct differences in arts and culture dollar activity per capita, the average number of arts and cultural organizations, and average budget size.
The Arts & Culture Ecosystem features a complex and interdependent set of relationships among: 1) arts organizations; 2) their communities, reflecting the people who live there, the artists and arts and cultural organizations, and local complementary or substitute businesses and organizations; and 3) the cultural policies that influence the production and consumption of arts and culture (see Figure 1).
Figure 1: Modeling the Arts & Culture Ecosystem
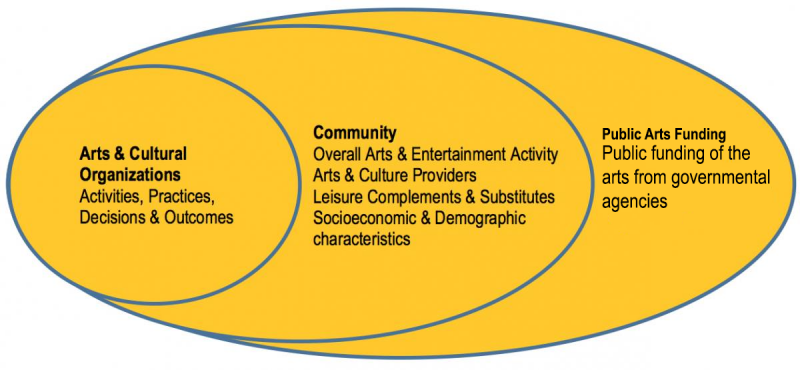
To understand what drives the performance of individual arts organizations that reside in distinct communities around the country, we attempt to model all of these different factors. Doing so requires collecting, integrating, and aggregating data from a variety of sources. At present, our data collection covers fiscal years 2007-2012 and our models and results focus on performance in 2008-2012, with data from 2007 acting as a baseline.
Building a Spatial Model: Arts & Cultural Organizations and a Sense of Place »
Arts and Cultural Organization Data
We have arts and cultural organization data from three distinct sources:
-
The National Center for Charitable Statistics (NCCS)
-
The Cultural Data Project (CDP)
By cross-referencing these distinct data sources, we have identified 55,449 unique arts and cultural organizations that reported activity during fiscal years 2007-2012. These 55,449 organizations form our Organizational Index database, which includes addresses, longitudes, latitudes, and overlapping organization identification numbers when an organization appears in multiple datasets. We went line-item by line-item in the organizational surveys to match responses to the same question asked in multiple surveys, determining whether the survey question was asking for identical information or whether it would be possible to create exact equivalents with the information available.
As discussed in the section on How We Determined Geographic Market Clusters, the longitudes and latitudes allow us to model the geographic proximity of arts and cultural organizations to each other, to other complementary or substitute business activities (e.g., hotels and restaurants), and to potential audiences that live within the organization’s trading radius.
The organizational data sources vary in terms of population coverage and in terms of data completeness. Data from the National Center for Charitable Statistics (NCCS), which collects and disseminates data from IRS 990 tax form filings, provides the most complete coverage. The number of arts and cultural organizations filing IRS form 990s varies each year, ranging from a low of 38,861 in 2007 to 42,550 in 2011. CDP provides the most complete data, collecting more than 1200 data points for individual arts organizations on an annual basis. CDP’s current coverage is 13 states and the District of Columbia. From 2007-2012, the CDP data represent approximately 30,000 individual records for some 15,000 organizations. Some organizations respond to the CDP survey only once; perhaps some of these organizations no longer exist. Other organizations have responded 2-3 years, reflecting the roll-out of CDP’s services over time. And we have detailed CDP data for many organizations for 4-6 years.
We use the organizational data for two purposes.
-
To model Arts & Cultural Organizations’ activities, practices, decisions, and outcomes, as depicted in Figure 1. Only the CDP and TCG data are comprehensive enough for this purpose. Because TCG data are limited to a single arts sector, our Arts Ecology modeling efforts tend to focus on CDP-covered markets.
-
To model total arts and cultural activity at the Community level, as depicted in Figure 1. Some measures appear in all three data sources. When that occurs, our default is to use the CDP measure if it exists. If not, we then use the TCG measure. Finally, we use the IRS measure. We combine four measures of total arts and cultural activity in the Community, specifically Total Assets, Total Expenses, Total Contributed Revenue and Total Program Revenue. We also incorporate a measure of the number of organizations in each arts and culture sector.
The resulting company database features more than 230,000 unique records for the five-year (2008-2012) period -- more than 46,000 organizations per year. We modeled the Arts and Culture Ecosystems nearly 300 metropolitan and micropolitan statistical areas. In 2012, these markets represented 69% of the US population. Our coverage will increase with time, and the findings presented in this report should be interpreted within the context of our current reach and coverage.
Community Data
As noted above, we used Arts and Cultural Organization data to model total arts activity in the Community. We also collected Census Bureau data to create a more complete model of the Arts Ecology at the Community level. These Census Bureau measures include:
-
Arts-related estimates of the number of arts and entertainment organizations, number of employees at arts and entertainment organizations, and number of independent artists;
-
Leisure complements & substitutes: e.g., number of hotels, restaurants, cinemas, and sports teams.
-
Individual-level estimates: for example, total population, per capita income, the percentage of individuals with college degrees, and the percentage of individuals in the labor force;
-
Household-level estimates: for example, percentage of households with income greater than $200,000;
We included data from the Internet Broadway database so that we can examine the effects of arts-related tourism in New York since it is such a large anomaly in the arts and culture ecosystem.
The Community data estimates were collected on an annual basis and geocoded by longitude and latitude at the census tract or zip-code level. These measures combined to create a Spatial Model with 215,000 records, representing data for roughly 40,000 zip codes over five years. We did this because arts organizations don’t exist in a vacuum. Geocoding lets us match each organization to its local market and examine how much that market’s characteristics affect the organization, and in what ways.
Cultural Policy Data
We model the effect of Cultural Policy using measures of grant-making activity from federal and state agencies, specifically:
-
Using data from the National Endowment for the Arts and Institute of Museum and Library Services, we incorporate the number of grants and level of Federal funding for the Community.
-
Using data from the National Association of State Arts Agencies, we incorporate the number of grants and level of State funding for the Community.