The Top 40 Most Arts-Vibrant Communities of 2022
Cities Listed for the First Time Include Salt Lake City, UT; Ann Arbor, MI; Kalamazoo-Portage, MI; and Brevard, NC
Executive Summary
After a brief hiatus, SMU DataArts, the National Center for Arts Research, is proud to once again release the Arts Vibrancy Index Report in its seventh iteration, celebrating arts-vibrant communities across the United States even as they grapple with the ongoing realities of the COVID-19 pandemic.
For this, our first AVI since 2020 we are not presenting a ranked list.
The pandemic has disrupted and reshaped our world in many ways; masks, vaccines, video conferencing, digital arts programming, and even delivery services have all developed to meet societal needs.
The arts and culture sector was hard hit by the pandemic. Reopening patterns were staggered from community to community, and some communities benefitted from government and private funding relief programs whereas others did not have commensurate access to resources.
With widescale closures beginning in March 2020, organizations across the country saw steep drops in earned revenue from ticket and admissions sales loss. Enduring COVID-related behavioral patterns have shifted ticket demand among audience members by roughly 20%, with fluctuating case rates keeping the sector in a reactive posture as organizations face uncertainty about future demand for arts programming. The initial shock of the pandemic on employment in the United States laid bare inequities in how arts and culture organizations cultivate and retain workforces. Unemployment in the arts was double that of overall national unemployment and Black, Indigenous, and People of Color as well as disabled individuals were disproportionately affected.
These workforce and audience shifts as a result of COVID-19 present to arts and cultural organizations the idea that traditional business models and methods of operation may need adjustment to endure in a world where COVID-19 becomes endemic. We feel that this moment calls for reflection on arts vibrancy from a place of gratitude for what communities have been through and solidarity in support of their resilience.
For this reason, we have decided to simply highlight the top 40 communities of different sizes this year and not provide an overall ranking. You may access a table of how each of these communities ranked on measures and sub-measures of arts vibrancy here; however, the lists are sorted alphabetically and not by overall arts vibrancy rankings. We hope you will stay tuned as we release profiles of vibrant communities around the country, and gather members of these communities for dialog about what it means to cultivate arts vibrancy locally in the coming months.
Key Findings
- Arts Vibrancy across the United States continues to evolve, especially relative to programmatic delivery shifts and localized funding necessitated by the COVID-19 pandemic.
- In follow-up surveys to organizations and individuals working in highly vibrant communities, many described investments in virtual and live-streamed offerings, as well as expanding outdoor programming to engage neighborhoods and foster connection during the lockdown.
- Beyond standard programming, many organizations in these communities mobilized to support their local constituents – through donating space or resources and distributing information on a variety of accessible offerings throughout the region.
- Issues around social equity were brought to the forefront and many organizations used art to amplify conversations around equity.
- In addition, arts leaders spoke to the impact of state and localized funding which provided immediate emergency relief. Concerns around equity and funding towards the ‘new normal’ also exist among the top communities.
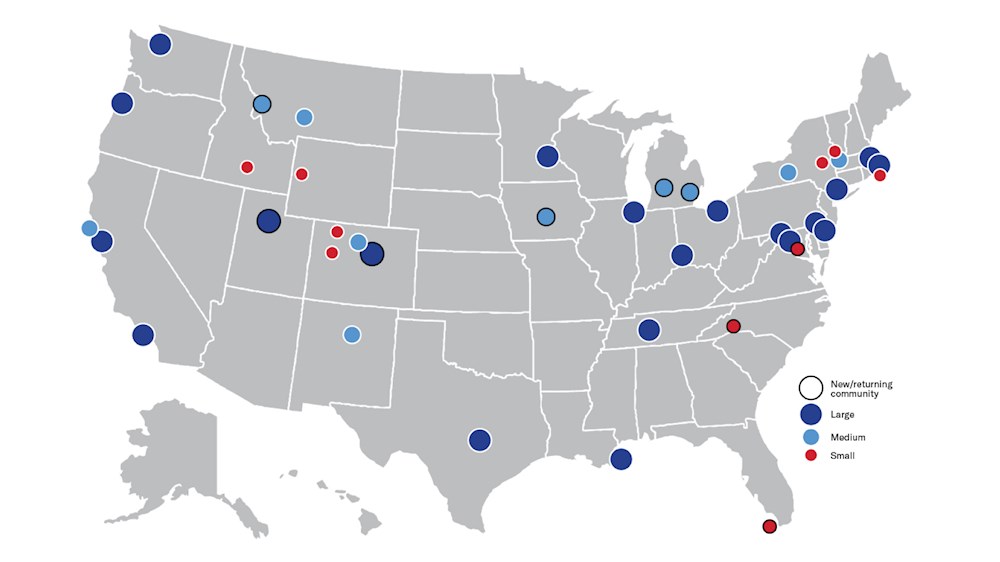
- Highly arts-vibrant communities are dispersed broadly throughout the United States. Every region of the country has vibrant arts communities that appear in this report (see Figure 1 and Tables 1, 2, and 3). This finding arises naturally out of objective analysis of the data, not from hand selection of communities to achieve geographic representation. From Utah to Florida, New York to Iowa, Arts Vibrant communities recognize regional artistic diversity and community success.
- Very large metropolitan statistical areas (MSAs) experience vibrancy through high concentration or extensive dispersion of arts and culture. Some large MSAs feature a strong concentration of arts vibrancy in the urban core with less going on in outlying districts whereas others feature vibrancy that is dispersed throughout the metropolitan area. Concentration versus dispersion of people and organizations is important to consider given the influence that distance has on attendance.
- Four new communities made it into the top arts-vibrant communities lists this year, joining over 80% of the previous communities making a return.
- Brevard, NC joined the list of top arts-vibrant small communities this year, and Easton, MD joined the list once again after making the list in 2016 as well as Key West, FL after making the list in 2018.
- Des Moines-West Des Moines, IA returned to the top list of medium-sized communities after appearing on it in 2017, and they were joined by communities new to the list Ann Arbor, MI, and Kalamazoo-Portage, MI.
- Salt Lake City, UT makes its debut on the top large community list this year complementing the other returning communities.
Fluctuations in a community’s inclusion in the top 40 Arts-Vibrant Communities list occur from year to year for several reasons:
- A community’s arts and cultural scene may have experienced the opening of an arts district or the closing of a performance space.
- Because we calculate the measures on a per capita basis, it could be that growth in arts and culture was on a different trajectory than that of the total population. For instance, a city experiencing a high influx of new residents will drop in the rankings if the area’s supply and demand for the arts and inflow of state and federal grants for the arts do not increase at a commensurate level.
- We include a cost-of-living adjustment to all financial metrics in order to level the playing field and the cost of living changes in communities over time. The cost of doing business varies based on local conditions, so the same dollar goes further in some communities than others.
- We continue to incorporate fresh data and learn about the role of distance, how concentration versus dispersion of arts organizations and people factors in, and the extent to which a community’s arts and cultural activity attracts or implicates its neighboring community members who commute as attendees or employees, for example. This has led us to make adjustments to our calculations every year.
We invited a panel of arts leaders from communities large and small to share first-hand accounts about their process for strengthening and sustaining arts communities during times of crisis and challenge, recovery, and reopening.