The Impact of COVID-19 on Employment: Arts & Culture Sector
October 14, 2021
Written by Daniel Fonner, Rebecca Johnson, and Cullen Keeter
Scroll down to read the latest update ⬇︎
The COVID-19 pandemic, now ongoing for over a year and a half, has wreaked havoc on businesses, supply chains, and most importantly, lives in communities around the world. Hospitality-related sectors, including the arts and culture sector, have been hit harder than many others. While 66.2% of all Americans over the age of 12 are fully vaccinated, some communities are still being ravaged by the virus. COVID-related mandates vary from state to state. Many arts organizations have reopened their doors, some with vaccine and mask requirements, but the sector has not fully recovered.
Throughout the pandemic, SMU DataArts has studied the arts and culture sector focusing on modeling early impacts, assessing impacts recognized in New York City, studying the distributions of federal funds for the Paycheck Protection Program (PPP), and exploring the scope of the federal Shuttered Venue Operators Grant (SVOG) program. Using data from the Census Bureau’s Current Population Survey (CPS), we’re probing another area of importance: unemployment characteristics within the sector.
Every month, the U.S. Census Bureau surveys roughly 60,000 households as part of the Current Population Survey, which provides employment data that the Bureau of Labor Statistics (BLS) uses to analyze the U.S. workforce. The survey allows for analysis of employment status, industry and occupation classifications, race, gender, and disability status, among many other characteristics. The survey also provides the mechanism by which the National Endowment for the Arts fields the Survey of Public Participation in the Arts and the Arts Basic Survey.
When assessing the employment characteristics in the U.S., the BLS focuses on the labor force, which includes individuals who are in the civilian, non-institutionalized population, ages 16 and older. Additionally, the labor force only includes those who are employed, absent from a job (vacation, illness, etc.), on layoff awaiting recall, or actively looking (last 4 weeks) and available for work.[1] Analysis of employment characteristics for specified industries is achieved through the use of NAICS codes; specifically for this analysis, codes associated with the arts and culture sector include:
- Performing arts companies (7111)
- Promoters of performing arts, sports, and similar events (7113)
- Independent artists, writers, and performers (7115)
- Museums, historical sites, and similar institutions (7121)
The following figure shows the monthly unemployment percentages for the arts and culture sector compared to the national unemployment rates from January 2020 through August 2021.
USA vs Arts & Culture Sector Unemployment Rates, 2020-2021
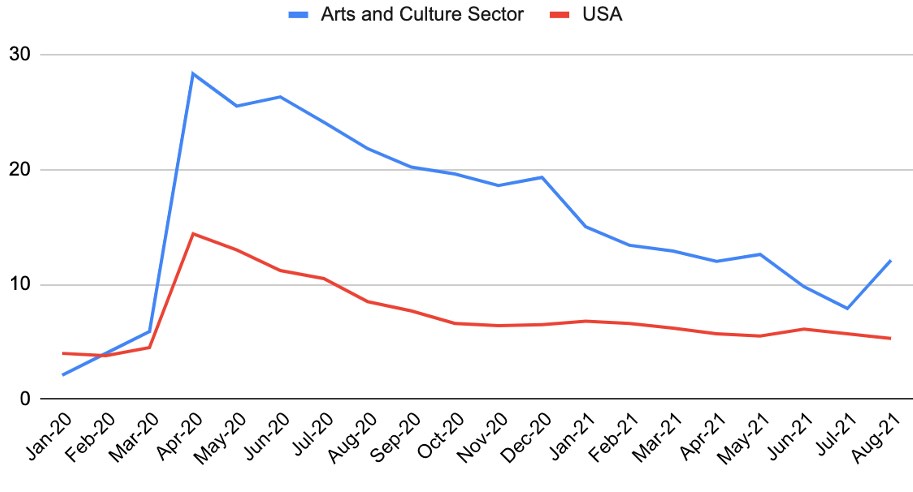
Source: U.S. Census Bureau, Basic Monthly Current Population Survey
In the first two months of 2020, the overall national and arts and culture sector unemployment rates were similar at about 4%. The turbulence of the onset of the pandemic led to skyrocketing unemployment in April 2020, with national unemployment at almost 15% and sector unemployment over 28%. Subsequent months trended downward across the country and sector, but the rate within the sector remained consistently two to three times higher than the national rate through May 2021. Unemployment dipped below 10% overall nationally in August 2020 and has remained so ever since. By contrast, arts and culture sector unemployment remained above 10% until June 2021, 10 months later. As of August 2021, the national rate had fallen below 6% while the sector rate increased to over 10% once again.
Note that the CPS asks respondents to base their information on their employment status as of the week containing the 12th day of the month. As the Delta variant’s spread accelerated in late July into August, its effects may be a contributing factor to the arts and culture sector unemployment spike in August. Data from future months will better tell the story of whether the increase in the sector is a growing trend or a one-month anomaly.
Parsing the CPS data to look at racial, disability, and gender characteristics within the arts and culture sector reduces the N size of the sample considerably, which prevents us from reporting on specific numbers with strong confidence. However, we can provide some general statements about the arts and culture sector:
- For virtually every month since January 2020, white respondents recognized unemployment rates roughly 1% below the sector unemployment rate. Black, Indigenous, Asian, and multiracial respondents collectively averaged unemployment rates about 6% higher than the sector overall, with greater spikes in the first four months of the pandemic.
- Those identifying their ethnicity as Hispanic recognized higher levels of unemployment than non-Hispanic survey respondents.
- Respondents identifying with a disability averaged unemployment rates three to four percentage points higher over the period of January 2020 through August 2021. That figure increases to about 12 points if looking only at the first six months of 2020.
- Differences associated with gender inverted over time. Female respondents had higher levels of unemployment before the pandemic, whereas males had higher levels of unemployment as COVID-19 spread. Between March and May 2021, as vaccines became more widely available, the trends inverted again, and male unemployment fell below female unemployment in the sector. Note that throughout the pandemic, more women left the labor force than men, which might contribute to the inversion of unemployment rates when utilizing the BLS’ labor force definition as described above.
While we can’t point to specific interventions as causes of shifts in unemployment within the sector, we can note that the federal PPP program distributed funds to support payroll expenses beginning in April 2020 and continuing through August 2020, and additional funding was distributed in early 2021 through May 2021. More specific to the sector, SVOG funding distribution began near the beginning of June 2021, continuing to the present time.
The household-level data from the CPS is complemented by establishment/business-level data on the number of jobs available in a given sector on a monthly basis. Americans for the Arts provides a summary of this data, noting that the number of jobs in the sector dropped significantly early in the pandemic and is still 16% lower today than before the pandemic began. In reporting on the monthly “employment situation” in the United States, the BLS combines both the establishment-level and household-level data to produce a fuller picture of the labor situation in the U.S.
There is encouraging news across the sector and globe as vaccines become more widely available and other treatments provide hope that we can suppress this virus and fully resume in-person activities safely. We will continue to monitor employment data and other facets of the sector to help organizations and policymakers better plan and assess the difficulties brought on by the COVID-19 pandemic.
Data Update
Published November 16, 2021
USA vs Arts & Culture Sector Unemployment Rates, 2020-2021
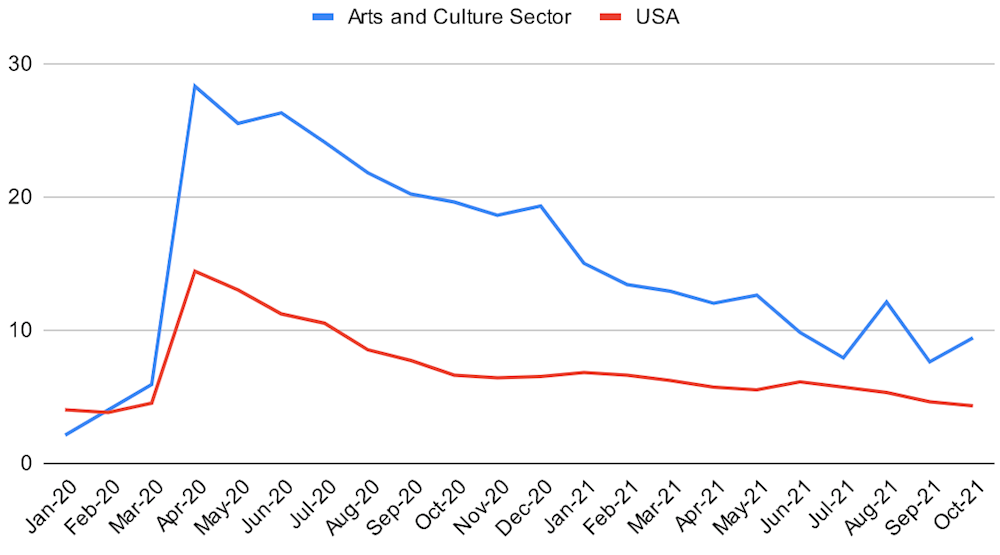
In September 2021, the national unemployment rate dropped below 5%, and within the sector, it dropped back under 10%. October showed slightly improved rates nationwide while the arts and culture sector recognized an increase to just under 10%. The seesawing motion within the sector over the last 6 months is moving in a downward trajectory overall. However, the turbulence is something to continue watching over the coming months.
There were no major changes in unemployment characteristics when looking at specific demographic characteristics within the sector. Unemployment rates by these characteristics mirror the turbulent nature of the sector as a whole.
Data Update
Published December 16, 2021
USA vs Arts & Culture Sector Unemployment Rates, 2020-2021
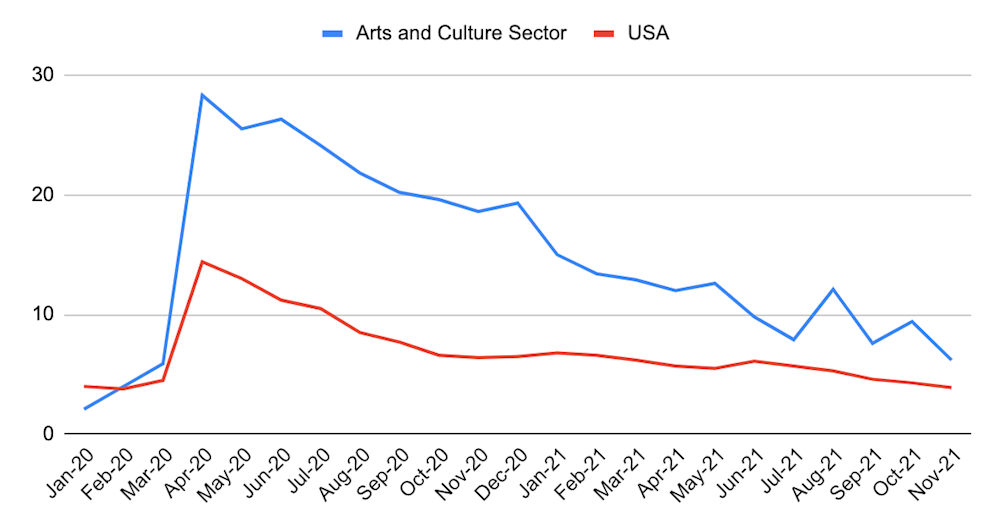
November 2021 data showed a continued downward trend in unemployment rates across the United States as well as in the arts and culture sector. The nationwide rate fell to about 4% while the sector rate fell to about 6%.
In the Bureau of Labor Statistics' monthly report, The Employment Situation, they discuss the unemployment rate as well as job gains nationally and in various sectors. Of the 210,000 nationwide increase to employment last month, 7,500 came from gains to the performing arts and spectator sports sector, while museums, historical sites, and similar institutions lost about 300 positions. The arts and culture sector today employs about 12% fewer people when compared to pre-pandemic levels in March 2020.
In early 2022, we will begin analyzing the employment side of this data to better understand who is working in the field in addition to continued analysis of unemployment rates.
[1] Keep in mind that this analysis focuses on those in the labor force as defined by the BLS above. This analysis excludes those “not in the labor force” as those respondents are not associated with specific industries.