Step-by-Step Guide for Applying Analytics & Research to Your Financial Strategies
- DataArts News
- Posted Jun 06, 2019
It’s time for staff salary increases, but can your organization afford them this year? The board wants to see higher attendance rates, but how many more attendees would you need to increase your bottom line? Do you know where you’re headed and what your organization should look like in five years?
Questions like these are the kind that keep arts and cultural leaders up at night and are the basis of board meetings, and they can all be informed by data. All too often, the reality is that unless data is reliable, easy to access, easy to understand, and we actually know how to use it, we might not use it at all.
Data exploration begins with a question, whether you’re seeking big-picture perspectives to prepare for long-term strategy development or something very specific for a singular project or unique campaign. Let’s say you’re working on your organization’s annual budget, and you’re thinking about how much you can expect to receive in contributions in the next year. This might send you down a rabbit hole, prompting a series of questions such as, are last year’s results really a fair basis for what to expect this year? If we spend more on fundraising, will we receive more in return? And how much, on average, are other organizations receiving in contributions?
Our research, resources, and tools are designed to help answer questions like these, keep you focused on the data points that matter most, and empower you for data-driven decision-making. Whether you have no experience or plenty, we are here to make it easy.
We understand – your passion for the arts was not driven by a desire to analyze data, so let’s walk through the process of utilizing our research alongside your custom reports.
Run Analytic Reports
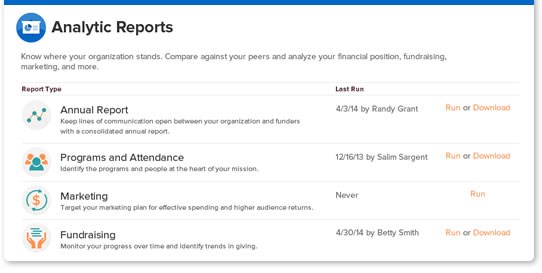
Our Analytic Reports contain the data from your completed Cultural Data Profile (CDP) in an easy-to-read, presentation-ready format. Each Analytic Report highlights one aspect of your organization, one type of financial statement, or a group of data organized around a central theme.
Access your reports:
- Log into your CDP account
- Scroll down to the Analytic Reports area where you’ll see all of the report options that are available
- Select ‘Run a Report’ to get started
To start analyzing your own fundraising trends, select ‘Trend’ and then choose ‘Fundraising Report’ from the dropdown menu. You can select up to three years of data to appear in the report. After you generate the report, you will see both the amount you received in contributions and the amount you spent on fundraising during the years selected. Take a look at the contributed revenue table to see your contributions summarized by source: individuals, foundations, government, etc. Looking at your contributed revenue trends in this way can help you see which values are consistent, and which fluctuate over time. This information can help inform your budget projections and better prepare you for the next year.
These metrics can also be helpful if you’re setting a fundraising budget and want to consider how the amount you spend on fundraising affects your contributions. Your fundraising trend report has several ratios that illuminate the relationship between these two items. The Fundraising Efficiency ratio tells you how much you generated in contributions for every dollar you spent on fundraising. This is a good metric to monitor if stretching every fundraising dollar is a priority. It’s great to look at this ratio over time, but this number may be more interesting if you view it in context.
Benchmark Your Metrics Using Our Research & Analytic Reports
Our data collection platform is standardized not only to streamline grant applications, but also to allow for comparison and trend analysis on a national scale. Our research team regularly analyzes the data we collect from organizations like yours, alongside data from other sources, to provide reports that shed light on the financial and performance health of the sector as a whole. On a quarterly basis, we release reports that focus on key topics such as sustainability, fundraising, marketing, working capital, and arts vibrancy as well as occasional white papers that dive deeper into specific markets and/or sectors.
To see how your fundraising activity compares to the national average, take a look at our recently published Fundraising Report, which highlights trends and key findings regarding the average return on investment in fundraising expenses, including trends in contributed revenue from 5 major sources. This report shows the data in aggregate for all organizations that complete the CDP survey, broken down by organizations’ budget size, discipline, and location.
If you want to benchmark your organization against a more specific set of organizations, head back to the Analytic Reports area and check out the Comparison Report. Here, you can create a custom comparison group, and run the same fundraising report to see how you measure up against your peers. If you discover that you’re earning less per dollar spent on fundraising than the national average from the Fundraising Report, or than your selected comparison group in the Comparison Report, that may inform how to adjust your goals as you work on your budget.
If you discover in the Comparison Reports that your Fundraising Efficiency metric is very different from that of your peers, you may wonder why. That’s where KIPI scores come in.
What’s a KIPI Score?
KIPI stands for Key Intangible Performance Indicator. KIPIs are the intangible aspects that influence an organization’s performance, such as good decision-making, artistic and managerial expertise, reputation and relationships, intellectual capital, and the quality of the workforce. Because these traits are, by nature, intangible, we cannot easily observe and measure them. And yet we all know how important they are. By using a statistical technique that we call “high-performance frontier analysis,” we can estimate how much these intangibles play a role in setting an organization apart from others.
The KIPI Dashboard allows you to measure your results against a group of similar organizations - not just organizations in the same location and doing the same work you do, but organizations that have similar access to funding, serve a similar population, are of a similar age, and share a number of other factors.
The idea behind KIPIs is that once you control for all of the similarities and differences between organizations, and truly create a level playing field, you can determine that the reason you are doing better than others, or they are doing better than you, must be because of something intangible, or something hard to measure like branding, or reputation, or having a superstar fundraiser on your board. Checking out your KIPI scores on the metrics that matter most to your organization offers great food for thought and can inform all of your organization’s planning, for both annual and long-term strategic plans.
Access your KIPI Dashboard:
- Log into your CDP account
- Click on the Performance Indicators tab
- Select ‘See Your KIPI Scores’ under any of the sample scores
Put Your Data To Work
We hope you’ll explore all of the tools and resources that SMU DataArts has to offer. We are always here to help through regularly scheduled webinars, educational resources, and a fully trained Support Staff that are versed in helping you with technical needs as well as financial accounting best practices. We’d love to hear from you about how you’re using these tools, and what additional resources we can provide to help you make informed, data-driven decisions so that your organization and community can thrive.