Appendix E: Methodology Detail
Here we provide information about the methodology employed in this study regarding the theories-in-use interviews, the CFE A&C grantee survey, and the survey of artists who worked with or were employed by CFE A&C grantees. The final section provides methodology for the quantitative financial and operating metric analysis.
E1: Theories-in-Use Methodology
The theories-in-use qualitative methodology allows participant voices to be loudest in the evaluation. It provides the opportunity for groups to clarify and articulate for themselves how change happens and lessons learned along the way (Zeithaml et al. 2020). It begins by seeking clarity and definition on the core constructs of interest. The next step involves development of if-then and if-then-except-when propositions of actions and outcomes, along with their supporting arguments. This process includes identifying antecedents and consequences, as well as internal- and external-moderating conditions. These propositions are then knit together to form a coherent chain of ideas or a mental model, which depicts multiple steps in the process of how change happens, and what factors inhibit or accelerate change. Along the way, we engaged in coding and analysis of interview data to identify commonalities in responses, and we abstracted observations up into higher-order categories.
Theories-in-Use Interviews. With the Ford team, we iterated through several drafts to arrive at the final semi-structured interview protocol. The Arts and Culture program staff provided us with a list of organizations to target for participation along with a rationale for each organization’s inclusion. Lane Harwell and Rocío Aranda-Alvarado sent email invitations to priority organizations on November 12, 2021. SMU DataArts staff sent two follow up emails to non-respondents. We then evaluated the characteristics of respondents for representativeness across grant programs, People of Color and Disability-center focus, budget size, and geographic distribution. There was a lack of representation of Black-led organizations and those from the South. This led to a decision to extend a small set of additional, targeted invitations on December 9, which were effective bringing these missing perspectives into the qualitative data collection process. These 20 interviews occurred in December 2021 through January 2022.
We reviewed each organization’s Fluxx application and website prior to the interview in order to enter into the conversation with a sense of the organization’s pre-grant goals, objectives, and self-defined indicators as well as the organization’s current mission, history, leadership, and programming. Specifically, the LOI’s and applications provide insight into each organization’s answers to the following questions: What goals and objectives did CFE A&C participants set for themselves as grantees? Did they plan to measure progress towards goals and objectives and if so, how?
Most organizations fall into several grantee categories. Seven are general grantees, four are collaborators in the Intercultural Leadership Institute, three are part of the Disability Futures program, three are SJB, three are BUILD grantees, two are vendors, two are GREJ, two are NYC Arts, two are ACT, and many are noted as associated with other grant programs.
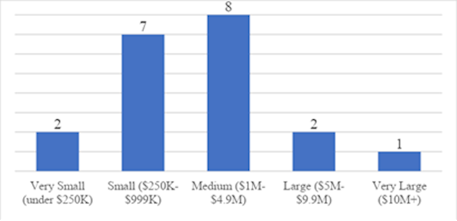
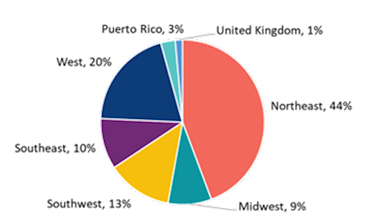
These 20 organizations are dispersed throughout five regions of the country, with greatest representation of organizations in the West (See Figure B1A). They represent all budget sizes, with skewing in higher numbers of small and medium budget organizations (see Figure B1B).
Figure E1A: Regional Representation
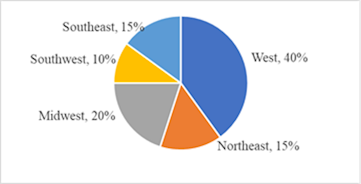
Figure E1B: Budget Size Representation
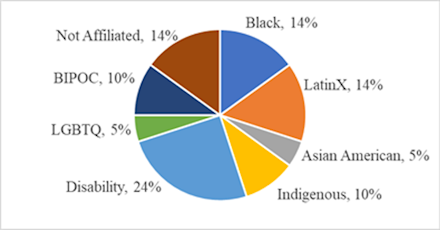
People of Color and Disability-centered organizations are well-represented (see Figure B1C). Only 3 organizations did not have a designation of being Black, LatinX, Asian American, Indigenous, BIPOC (broadly), LGBTQ, or Disability-centered.
Figure E1C: Racial and Disability-Centered Representation
The tenure of organization leaders ranges from less than one year to 39 years. Nearly half (45%) of the individuals interviewed were founders or co-founders of the organization. On average, interviewees have been in their current role with their organization for 10 ½ years: those who are founders have an average tenure of 15 years whereas others average 7 years.
We note that eight organizations that were invited to participate either did not respond or initially responded but never replied to requests to schedule time. Four are BUILD grantees, and among them are two organizations that are also part of Ford’s border project. Two others are part of the AIM program and we have qualitative data on these organizations from interviews conducted as part of that project, although the two sets of interview questions do not fully align.
E2: Grantee Survey Methodology
Once coding and analysis of the interviews were complete, we created a survey that posed questions that aligned with those asked during the interviews. Survey response options were created that mirrored the most common responses provided by interviewees. The intent of the survey was to test whether the experience and perspectives of the 20 TIU interviewees was generalizable to the broader population of CFE A&C grantees.
The CFE A&C Grantee survey focused on gathering input from arts and culture leaders on the Ford Foundation’s funding strategy, including factors that drive or inhibit an organization’s ability to accomplish goals as well as the contributions of the CFE A&C grant program. The questions in the grantee survey focused primarily on an organization’s work with Black, Indigenous, and People of Color (BIPOC) artists, storytellers, and/or disabled artists. Responses were captured directly by SMU DataArts.
The Ford Foundation CFE A&C Grantee survey was conducted March 21– May 2, 2022. Ford sent invitations to complete the survey to 212 CFE A&C grantee organizations who did not participate in qualitative interviews. Over the course of the survey period, three reminders were sent to non-respondent grantees. Those who participated in the grantee survey or who administered the Artist & Storytellers survey were entered into a gift card raffle.
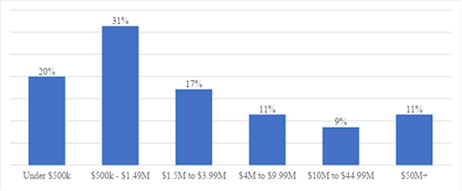
The Ford Foundation CFE A&C Grantee survey received responses from 70 organizations, for a response rate of 33%. The 70 arts and cultural organizations have a median budget of $1.7 million and a mean budget of $2.7 million. They range in annual budget size from $20,000 to $451 million. Figure B2A shows the distribution of grantee survey respondents by organization budget size.
Figure E2A: CFE A&C Grantee Survey Respondents, by Budget Size
The location of survey-takers is largely representative of the geographic distribution of the universe of CFE A&C grantees, which is also dominated by organizations in the Northeast (see Figure B2B). There were roughly the same proportion of participants from the Southeast and Southwest as with the interviews, but fewer from the West and Midwest.
Figure E2B: CFE A&C Grantee Survey Respondents, by Geographic Representation
The tenure of organization leaders ranges from less than one year to 44 years. One of every four arts organizations are led by founders or co-founders. Very similar to interviewees, survey respondents have been in their current role with their organization for an average of 10 ½ years: those who are founders have an average tenure of 15 years whereas others average 9 years.
E3: Artist and Storyteller Survey Methodology
We conducted a survey of the artists and storytellers who worked with CFE A&C arts and culture grantees during the period of funding. The Artist & Storytellers survey was conducted March 24– April 30, 2022. All 230 CFE A&C grantee organizations received instructions on how to participate in and administer the Ford Foundation Artist & Storytellers survey. Of those invited, 69 grantees (30% of total invited) signed up to administer the Artist & Storytellers survey. Over the course of the survey period, three reminders were sent to inactive organizations who signed up to administer the survey. Administration included compiling a list of artists and storytellers who worked at an organization and sending emails requesting participation. Communication with these organizations administering the artist survey was managed by SMU DataArts.
The Artist & Storytellers survey was a brief five-minute questionnaire that aimed to understand the impact of the Ford Foundation’s funding strategies on BIPOC artists, storytellers, and/or disabled artists. Artists and storytellers who completed the survey were also offered an opportunity to be included in a gift card raffle.
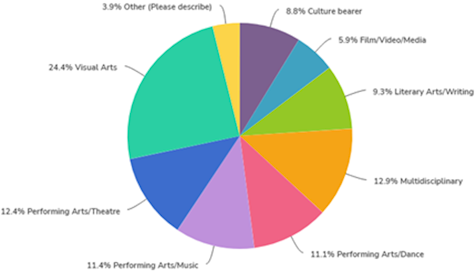
We received 614 complete responses from artists who worked with 54 CFE A&C grantees. Collectively, they represent a spectrum of disciplines, as shown in Figure B3A.
Figure E3A: With which of the following disciplines do you primarily identify?
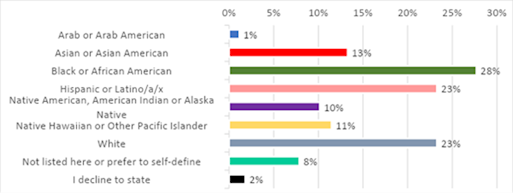
Respondents’ racial identity was quite diverse (see Figure B3B). Black or African American artists were the most highly represented group, followed by Hispanic/Latino/a/x and White. These categories are not mutually exclusive; 13% of artist respondents report having multiple racial identities. People with a disability made up 17% of respondents. Two of every three artists who self-identify as a person with a disability are intersectional: they also self-report their racial identity as Black, Asian or Asian American, Native American, American Indian, Alaska Native, Native Hawaiian or Other Pacific Islander.
Figure E3B: I identify as…
The processes used for collection, storage, and analysis of data ensure the anonymity of respondents. Potential respondents to the Artist & Storytellers survey received a web link via email directly from their respective organizations who opted into administering the survey. Activating the link took respondents directly to the questionnaire, which required about five minutes to complete. Responses were captured directly by SMU DataArts. Data were not transmitted to the Ford Foundation; data were instead stored in a secure, third-party survey data system accessible only to SMU DataArts. The study did not collect any personally identifying information, such as name or postal address. Email addresses were only collected for purposes of the optional gift card raffle. Data analysis was conducted by SMU DataArts' in-house research staff.
E4: Financial and Operating Metric Analysis Methodology
One research question focused on CFE A&C grantees that we will analyze using Cultural Data Profile (CDP) data: 1) Did CFE A&C participants become well-resourced and increase both financial and operating stability?
As part of the methodology for exploring this question, we analyzed data sourced from Cultural Data Profiles (CDP) submitted by Ford Foundation grantees as well as audits from Ford’s grant management system, where available. Among CFE A&C grantees, 38 organizations had data covering all fiscal years 2017, 2018, 2019, and 2020 for the trend analysis. The trend analysis covers topics such as overall unrestricted contributed revenue, contributed revenue sources, working capital, bottom line, revenue diversity, visitor-to-staff ratios, and full-time staff turnover. This data was chosen over broader coverage of CFE A&C organizations from IRS 990 data as the CDP and audit data allowed for more detailed analysis at a level not possible with 990s.
In this report, trend data for the CFE A&C grantees is compared against organizations in the SMU DataArts CDP database for organizations that self-identified as having missions rooted in or primarily serving Black, Indigenous, People of Color, or disability-focused communities. The CDP survey instrument can be viewed here.
E5: Workforce Demographics
In this report, findings related to workforce demographics are shared from SMU DataArts’ 2021 field-facing survey. This survey, for which organizations and individuals volunteered their participation, was conducted by SMU DataArts from August 15, 2021 through December 17, 2021 (open workforce demographics studies are offered periodically by SMU DataArts). Organizations administered the study to their workforce members through an online platform. They ranged in budget size from $50,000 to $52 million, with half having a budget under $1 million. These organizations are located throughout the U.S., with highest survey representation in the Mid-Atlantic region and lowest in the Southeast and Northwest. Four self-identify as an organization by or for People of Color. Individuals submitted their anonymous responses directly to SMU DataArts.15
The processes used for collection, storage, and analysis of data ensure the anonymity of respondents. Potential respondents to the Workforce Demographics survey received a web link via email directly from their respective organizations who opted into administering the survey. Activating the link took respondents directly to the questionnaire, which required about five minutes to complete. Responses were captured directly by SMU DataArts. Data were not transmitted to the organization; data were instead stored in a secure, third-party survey data system accessible only to SMU DataArts. The study did not collect any personally identifying information, such as name or postal address. Data analysis was conducted by SMU DataArts' in-house research staff.
The SMU DataArts Workforce Demographics study collected data from individuals on five demographic characteristics: 1) Heritage (race, ethnicity, and nation of origin); 2) Age; 3) Gender; 4) Sexual Orientation; and 5) Disability. SMU DataArts developed the core workforce demographics survey instrument over the course of nine years through extensive piloting and feedback from multiple communities across the country. For more information on the development of the survey instrument see “Identity and the Cultural Workforce: Lessons Learned in Seven Years and Three Cities”, accessible at https://www.giarts.org/identity-and-cultural-workforce.
The question that asked individuals to self-identify as a person with a disability read as follows:
I am a (Check all that apply)
[ ] Person who is blind or visually impaired
[ ] Person with a chronic illness disability
[ ] Person with a communication disorder, who is unable to speak, or who uses a device to speak
[ ] Person with an emotional or behavioral disability
[ ] Person who is deaf or hard of hearing
[ ] Person with an intellectual, cognitive, or developmental disability
[ ] Person with a learning disability
[ ] Person with a mental health disability
[ ] Person with a physical disability or mobility impairment
Or
( ) Person without a disability
( ) My disability is not listed here
( ) I decline to state
The survey instrument, which includes the set of questions that asked individuals to self-identify their Heritage, Gender, and Sexual Orientation, can be viewed here.